Case studies / 06
Digital NPS dashboard
- Client
- adidas — Digital Analytics
- Duration
- 4 weeks — 2-day workshop, 2 days of testing, weekly touchpoints
- Role
- UX designer
# The project
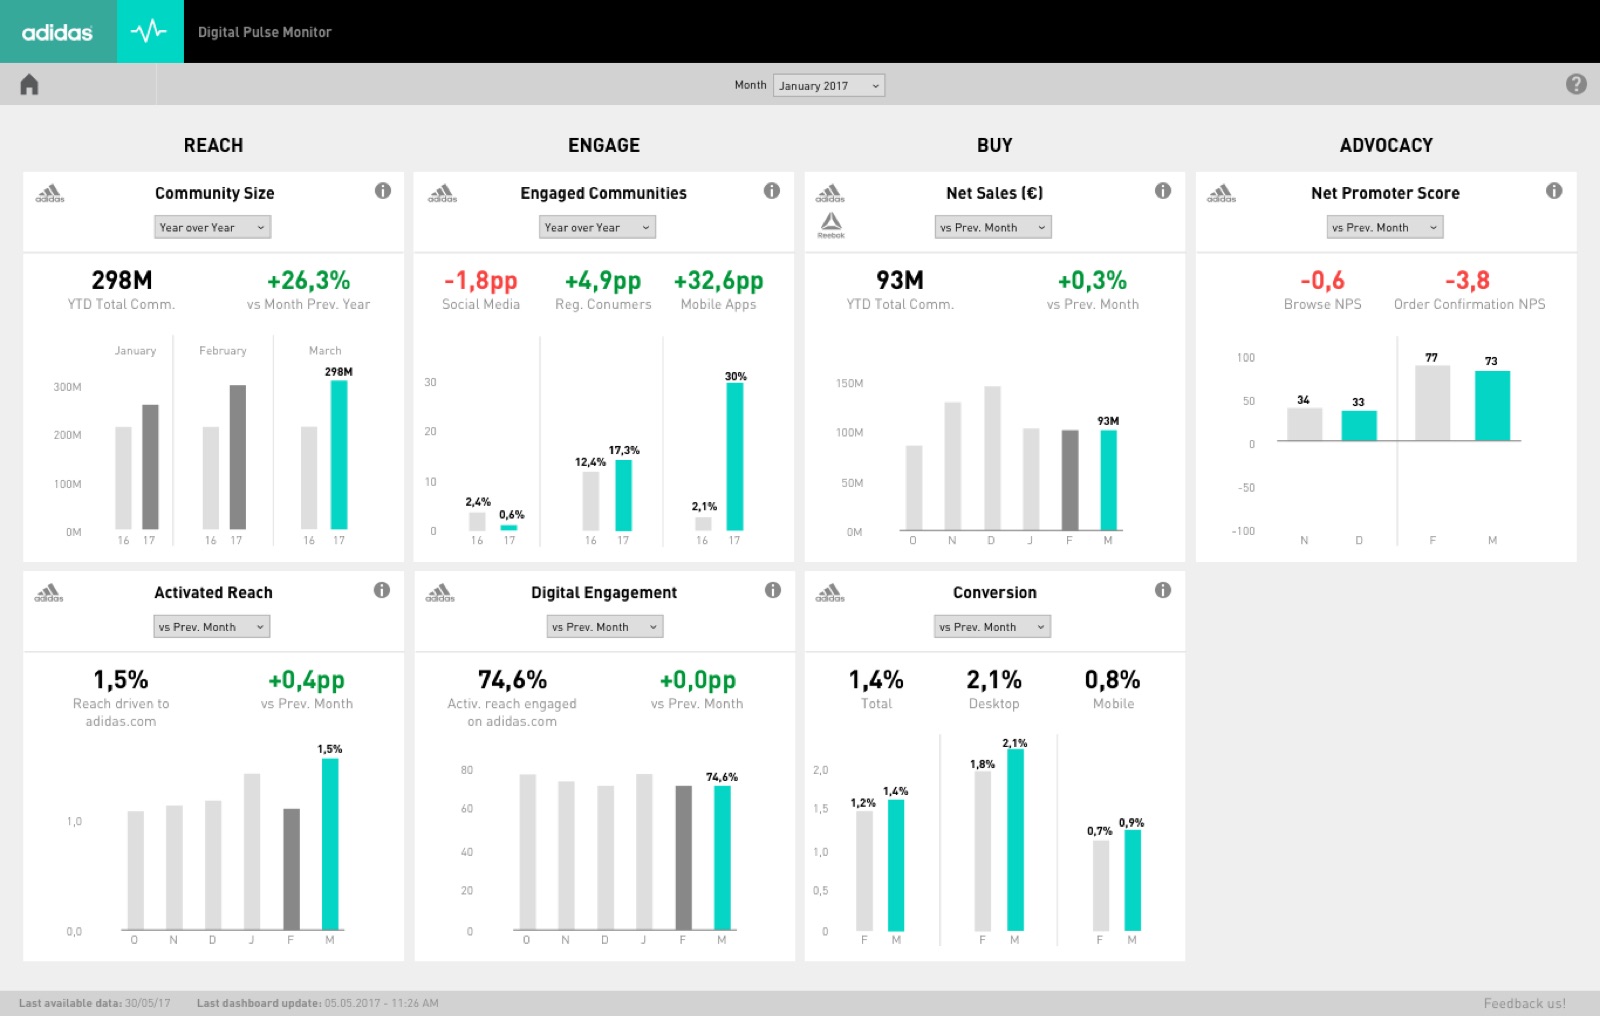
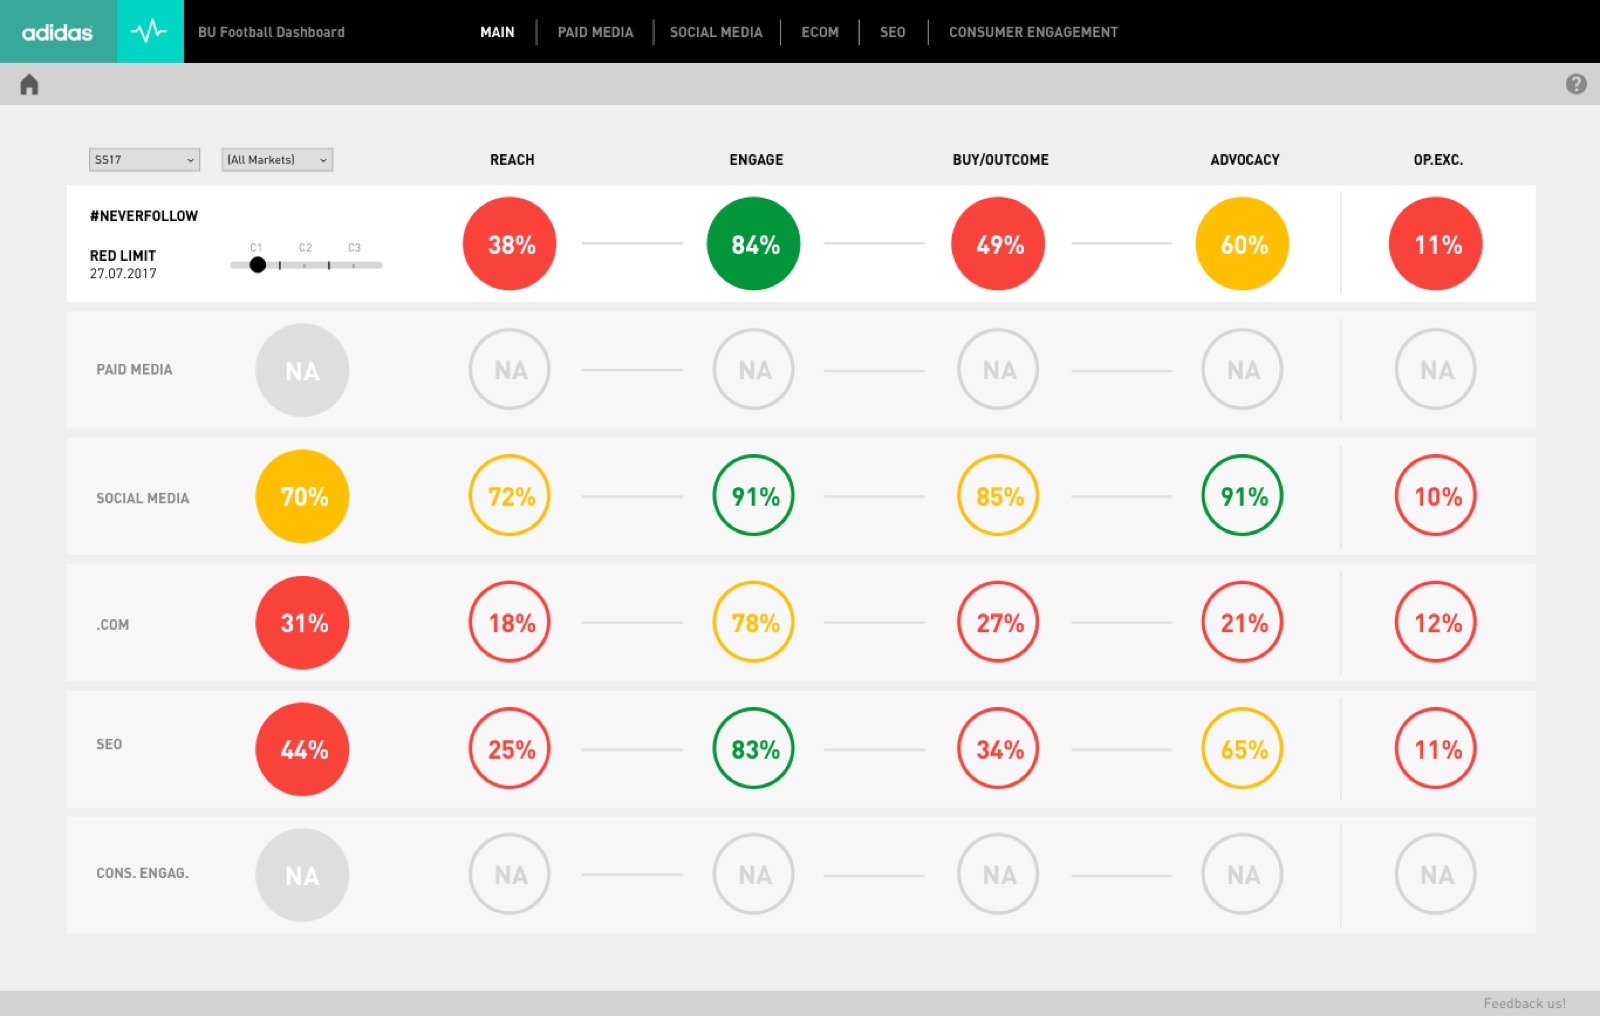
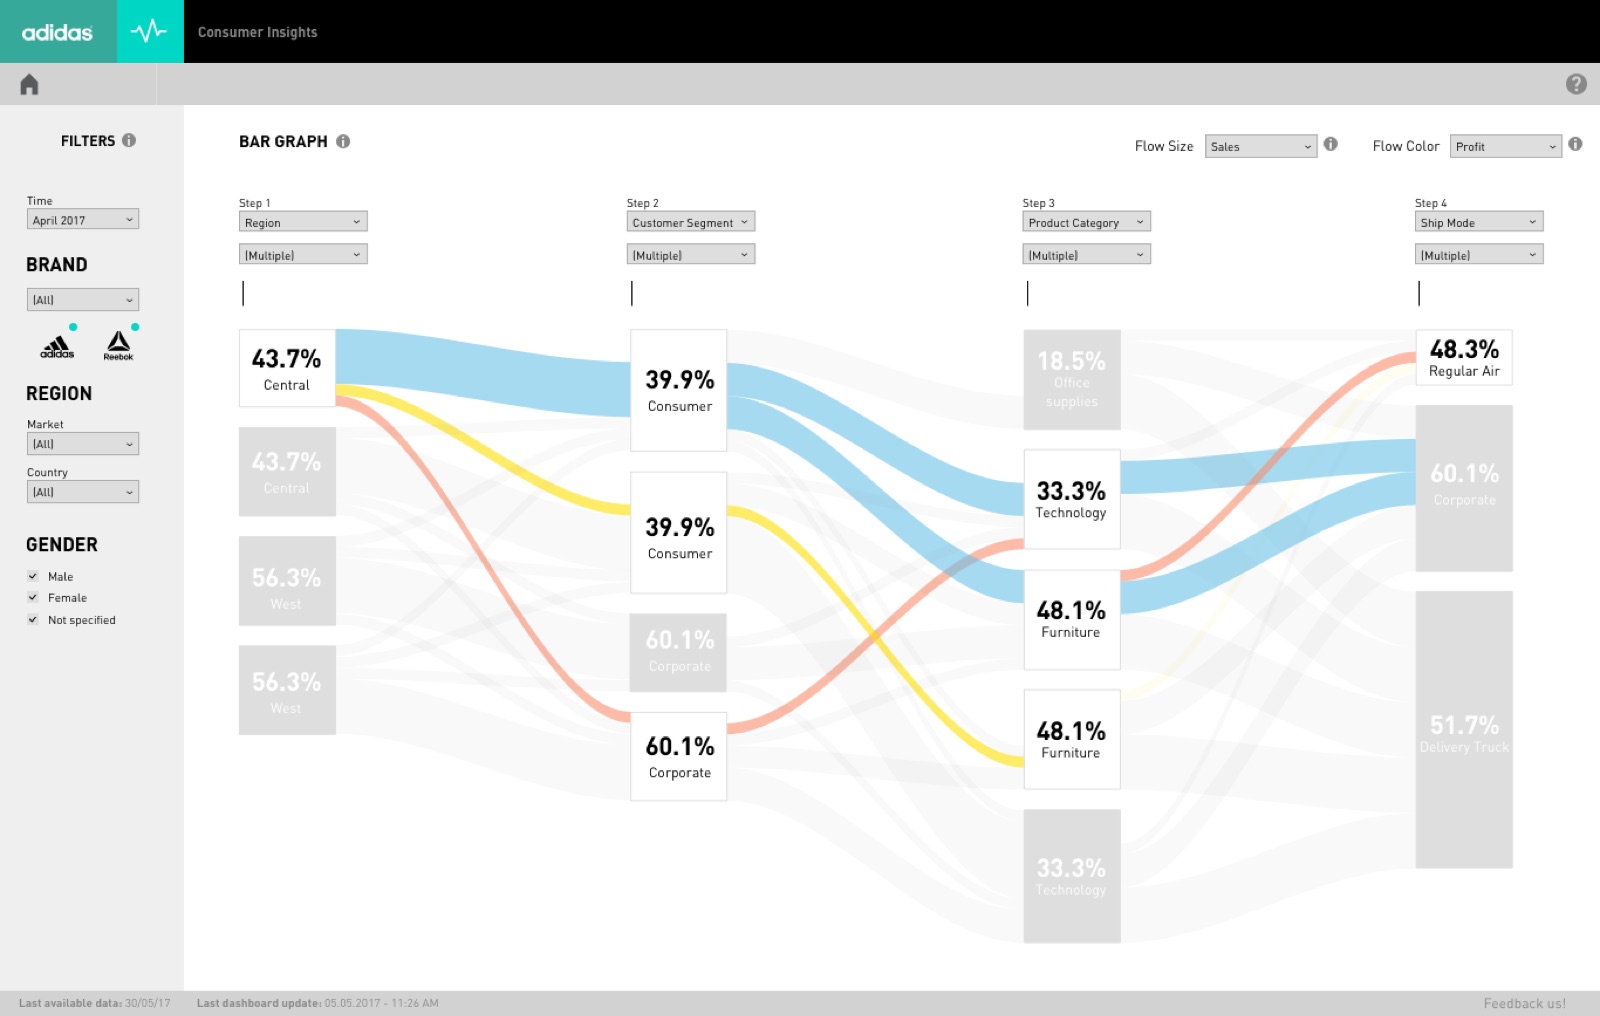
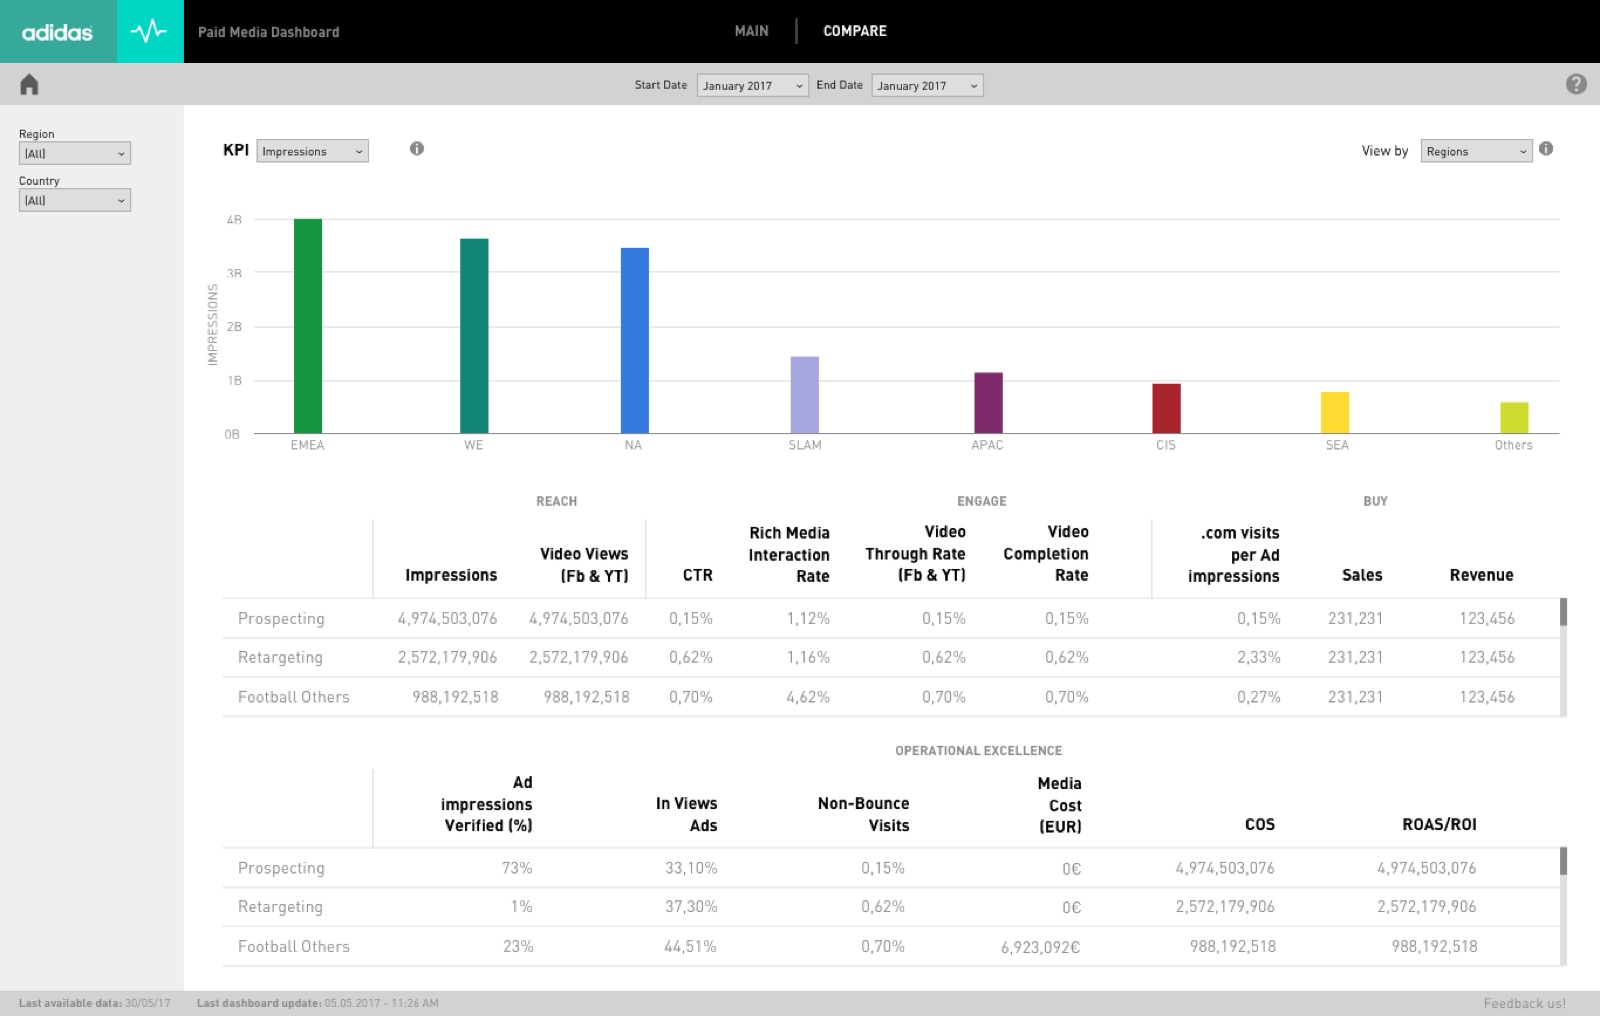
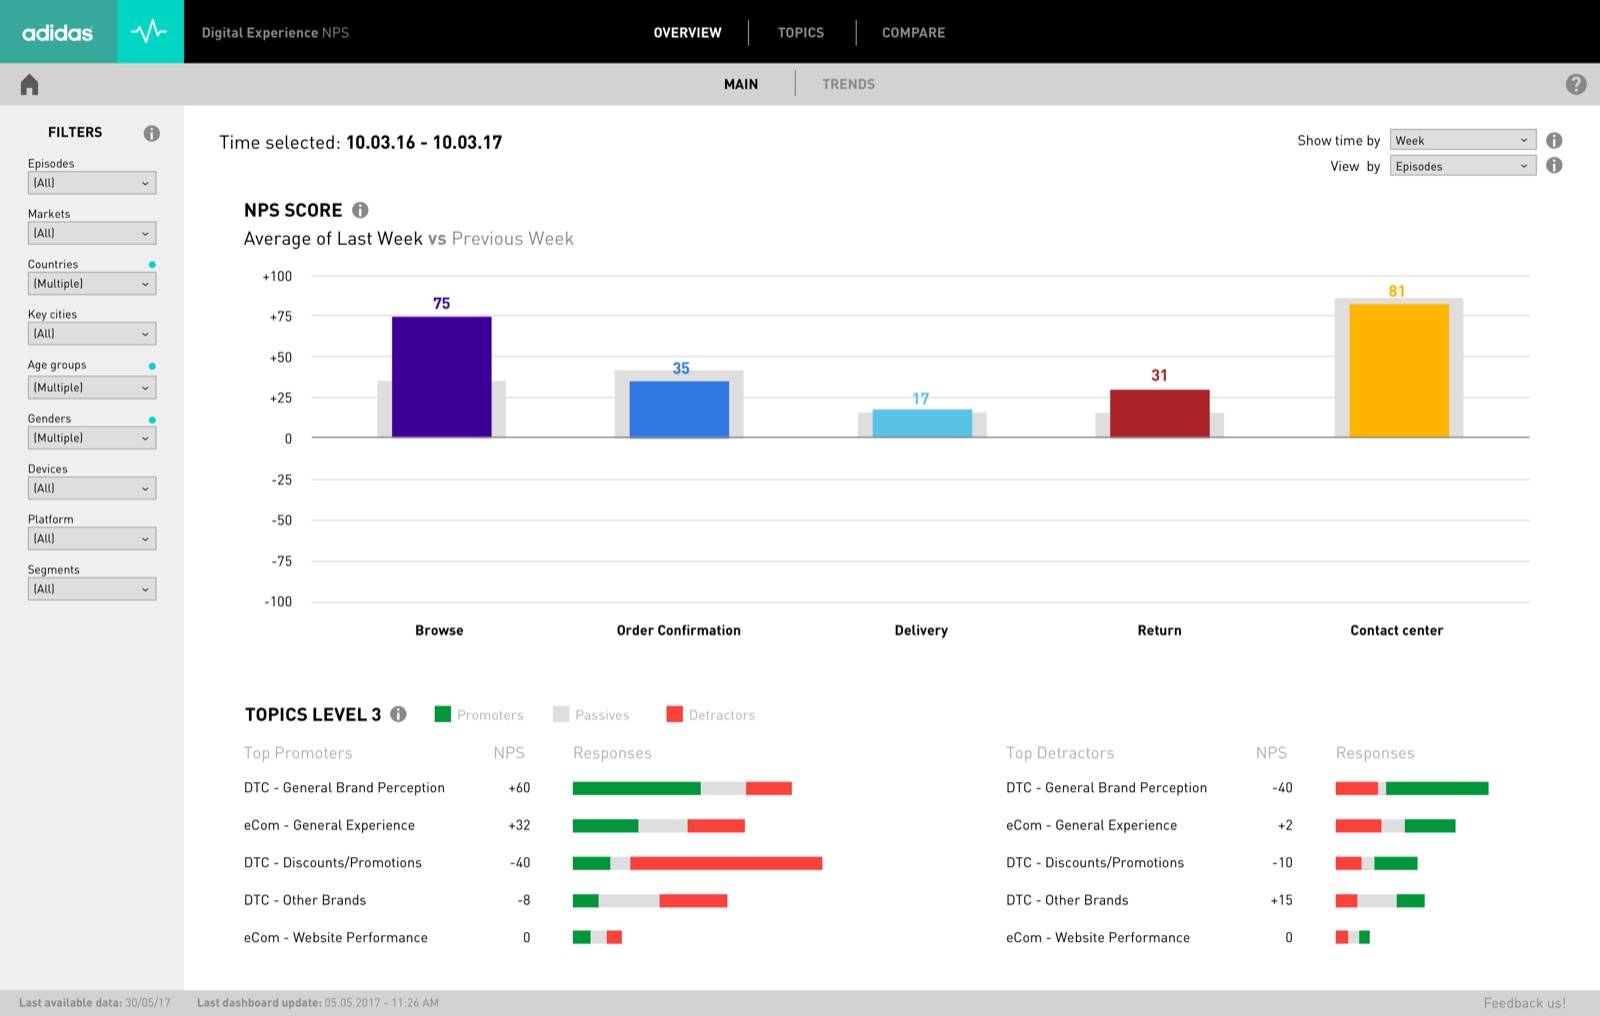
An approach to creating a better experience for analysing and using data: understanding how satisfied — and so how loyal — customers are likely to be, through NPS.
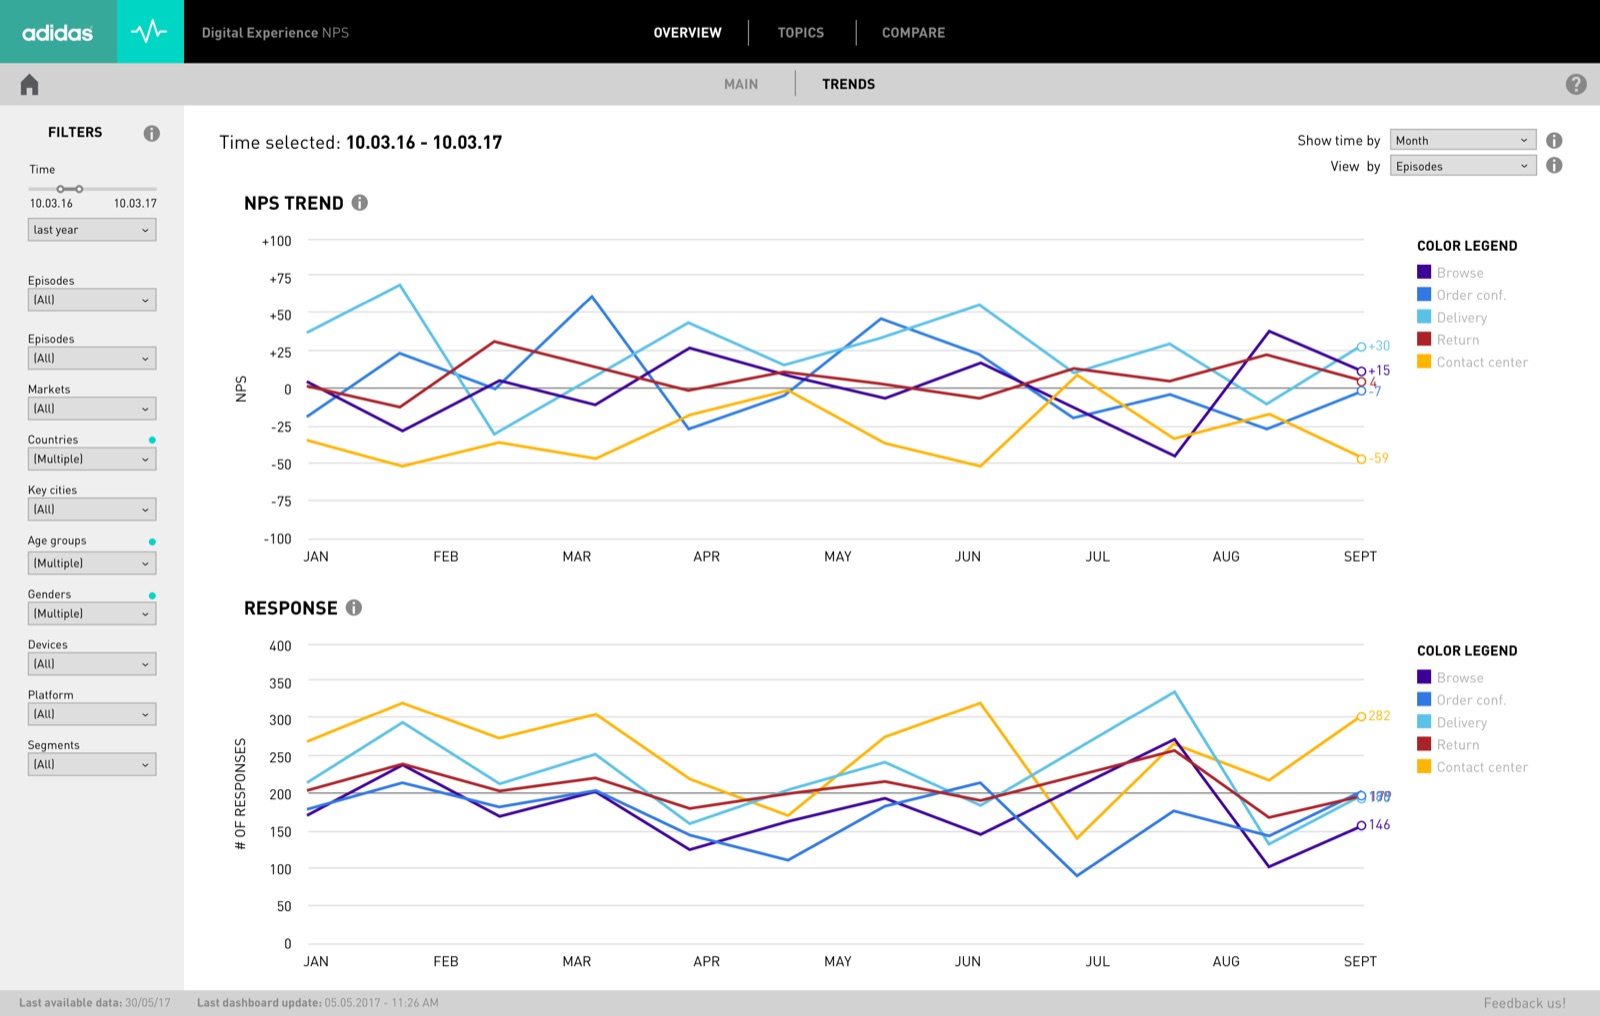
The Net Promoter Score was tracked across the digital customer journey, broken down into episodes (browse, delivery, returns…) and topics. The goal was a dashboard that leadership could read at a glance, and that analysts could use to dig into what drives the score and what impacts it.
# Team
Plus 3 stakeholders — NPS champion, NPS manager, director of digital analytics — and 12 users for testing.
# Understand
Homework
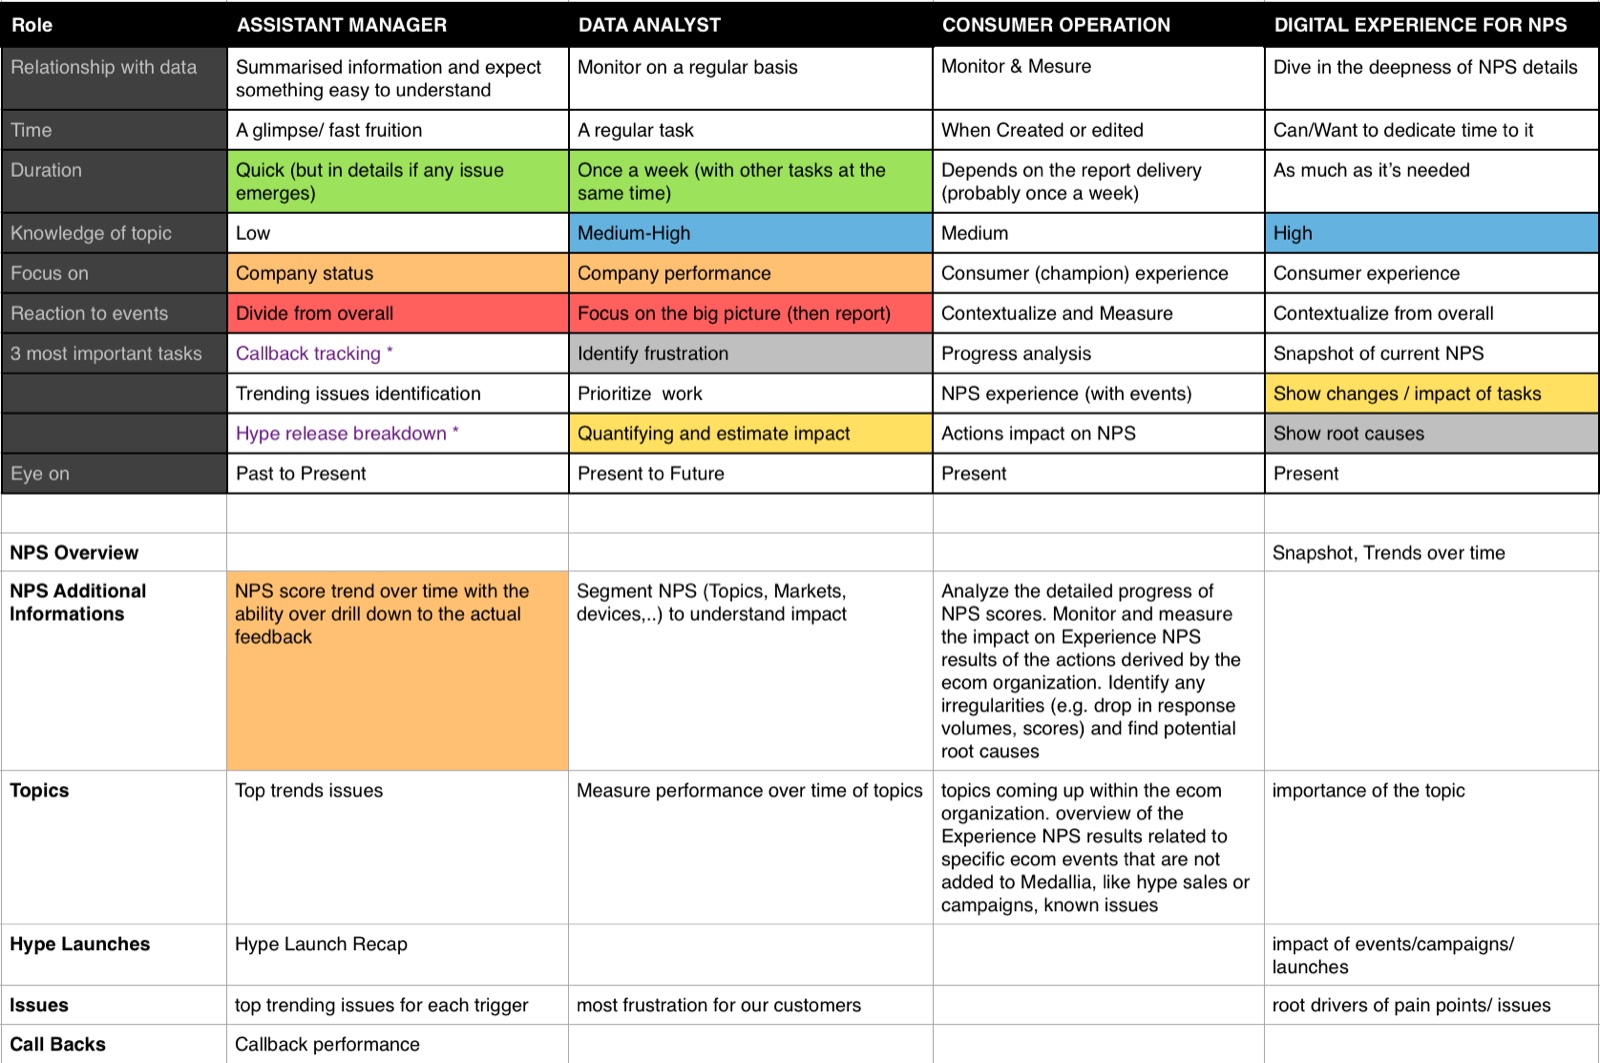
Before the workshop, each role mapped how it works with NPS today: what it monitors, how often, the depth of analysis it needs, and what it does with the results.
Workshop & personas
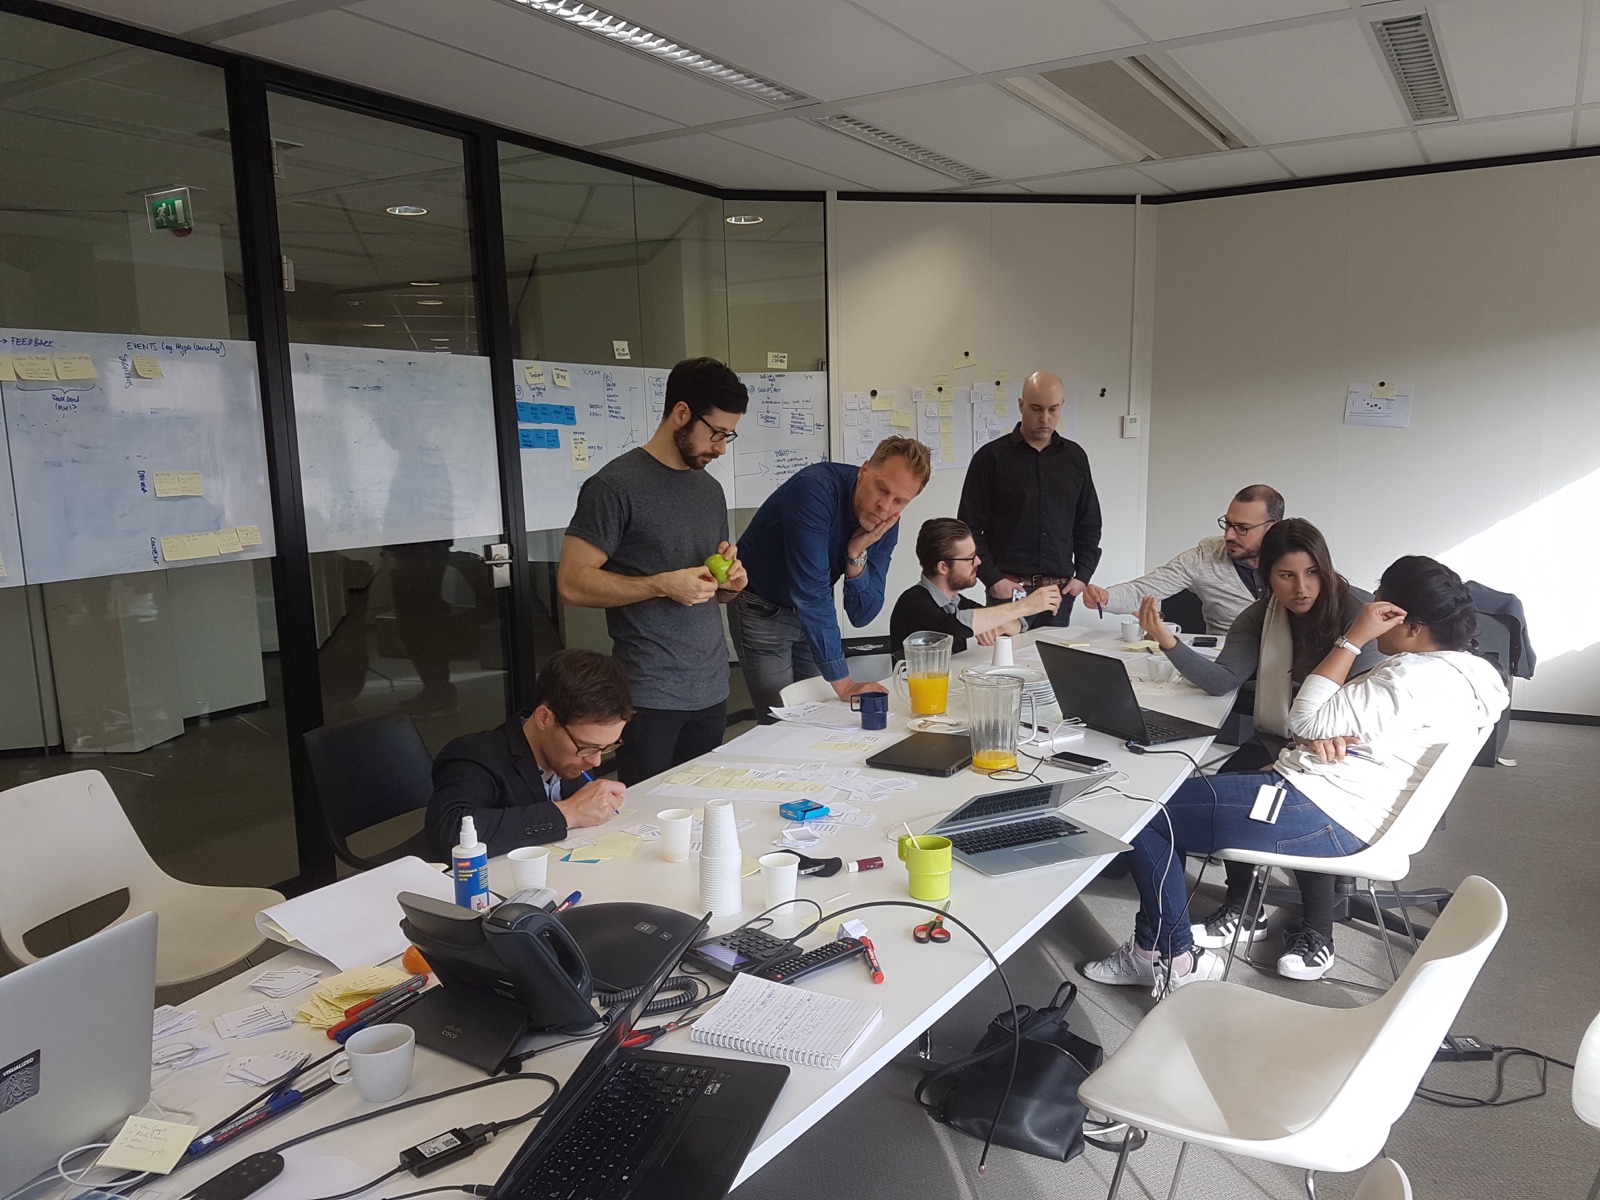
Personas are user archetypes that help analyse research and find patterns: who users are, what they need to accomplish, their skills and pain points. They guide decisions on features, navigation, interactions and visual design.
Gurjyot
Data analyst · the “active observer”
Data analyst, 26, born in Mumbai, works in Amsterdam. Master’s in maths and statistics; joined a year ago and wants to lead a team someday.
“My job is dictated by regular tasks. And having a routine is my anchor. There’s so much to monitor, I can’t waste time.”
- Goals
- A clear report of the status of his market; useful and fast, no time wasted
- Actions
- Weekly NPS market reports, ad-hoc research on topics and segments, identifying drivers, sharing insights with other departments
- Tools
- Analytics back ends, Tableau, Python, Excel
- Frustrations
- Too complicated, too many tools, too much manual labour
Amanda
Product manager · the “decision maker”
Product manager, 45, born in Stuttgart, works in Herzogenaurach. 17 years at the company, two daughters; schedules, organises and coordinates everything.
“I need to be informed on time and understand everything immediately. I’m the one who then takes decisions.”
- Goals
- An overview; easy to use, clear structure
- Actions
- Inform senior leadership, request detailed analyses, enable cross-functional work, decide based on the market situation
- Tools
- Dashboards, MS Office, meeting tools, Jira
- Frustrations
- Too many unconnected sources, too complicated, too technical
The decision maker wants summarised information and trends, easy to understand — mostly the NPS overview. The active observer monitors on a regular basis and goes deep into details, topics and events.
# Scenarios
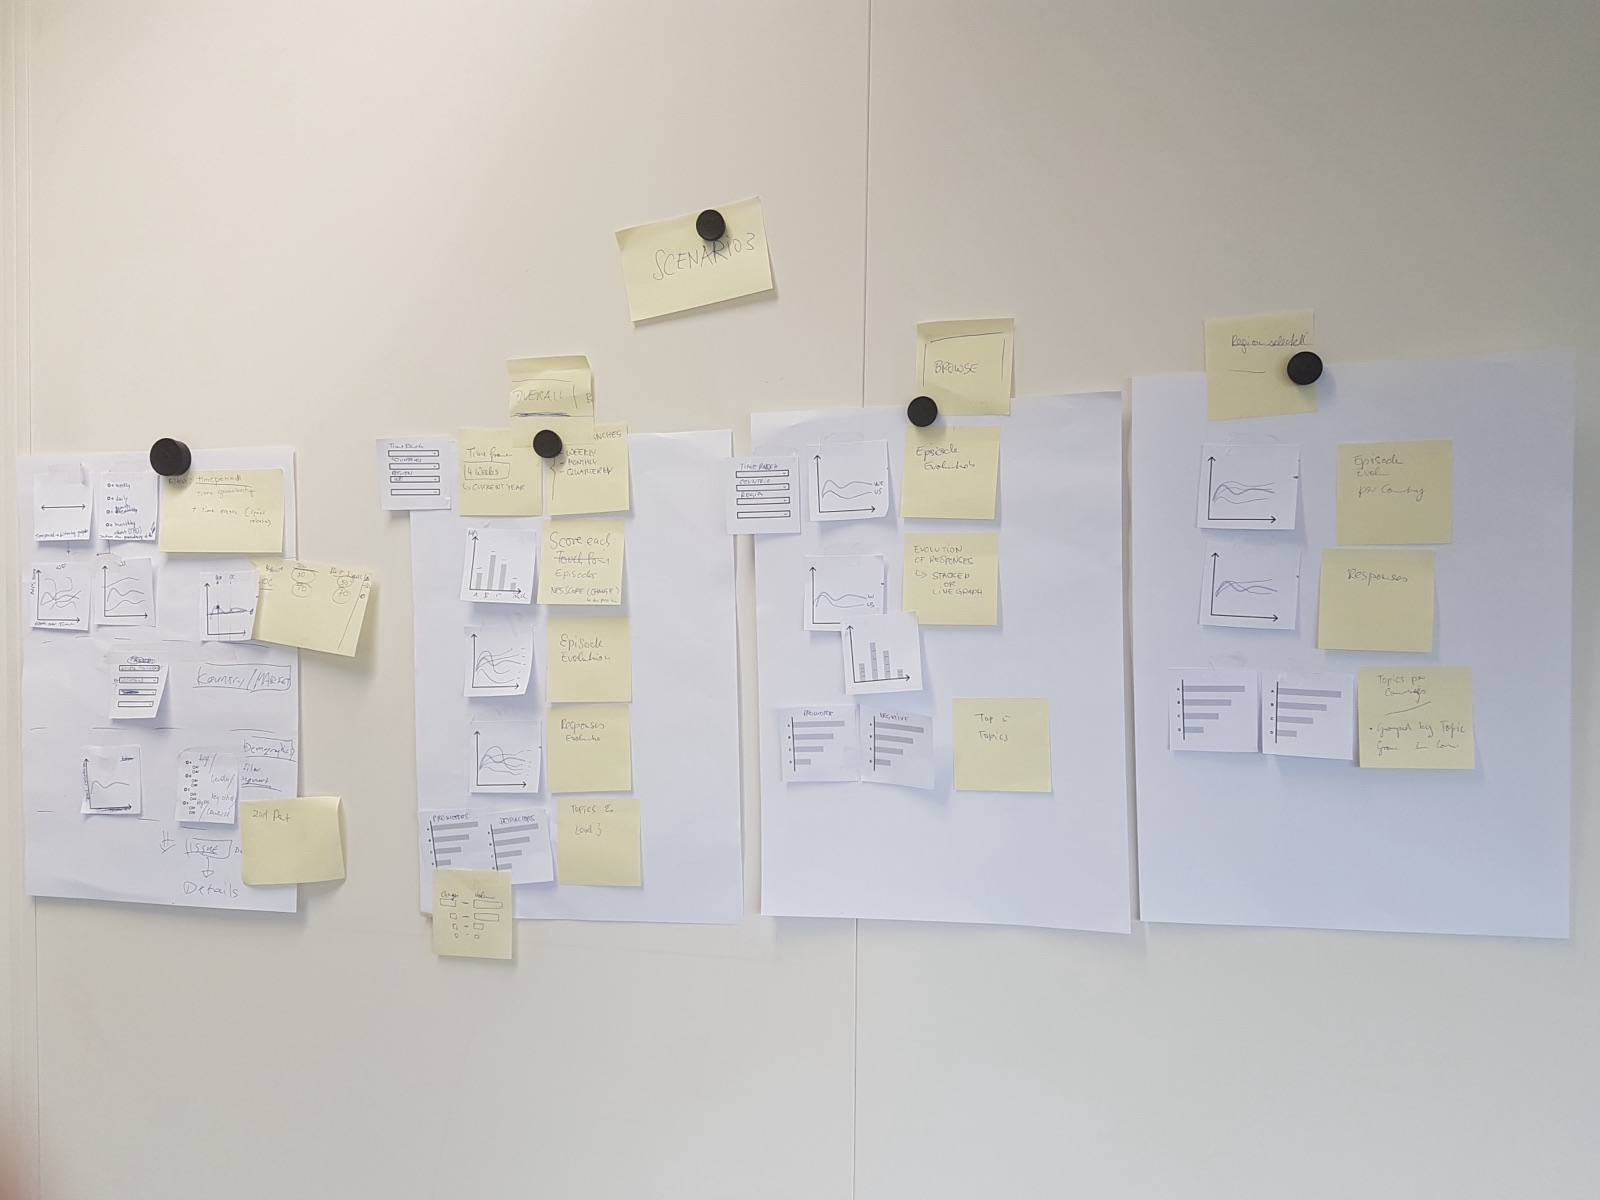
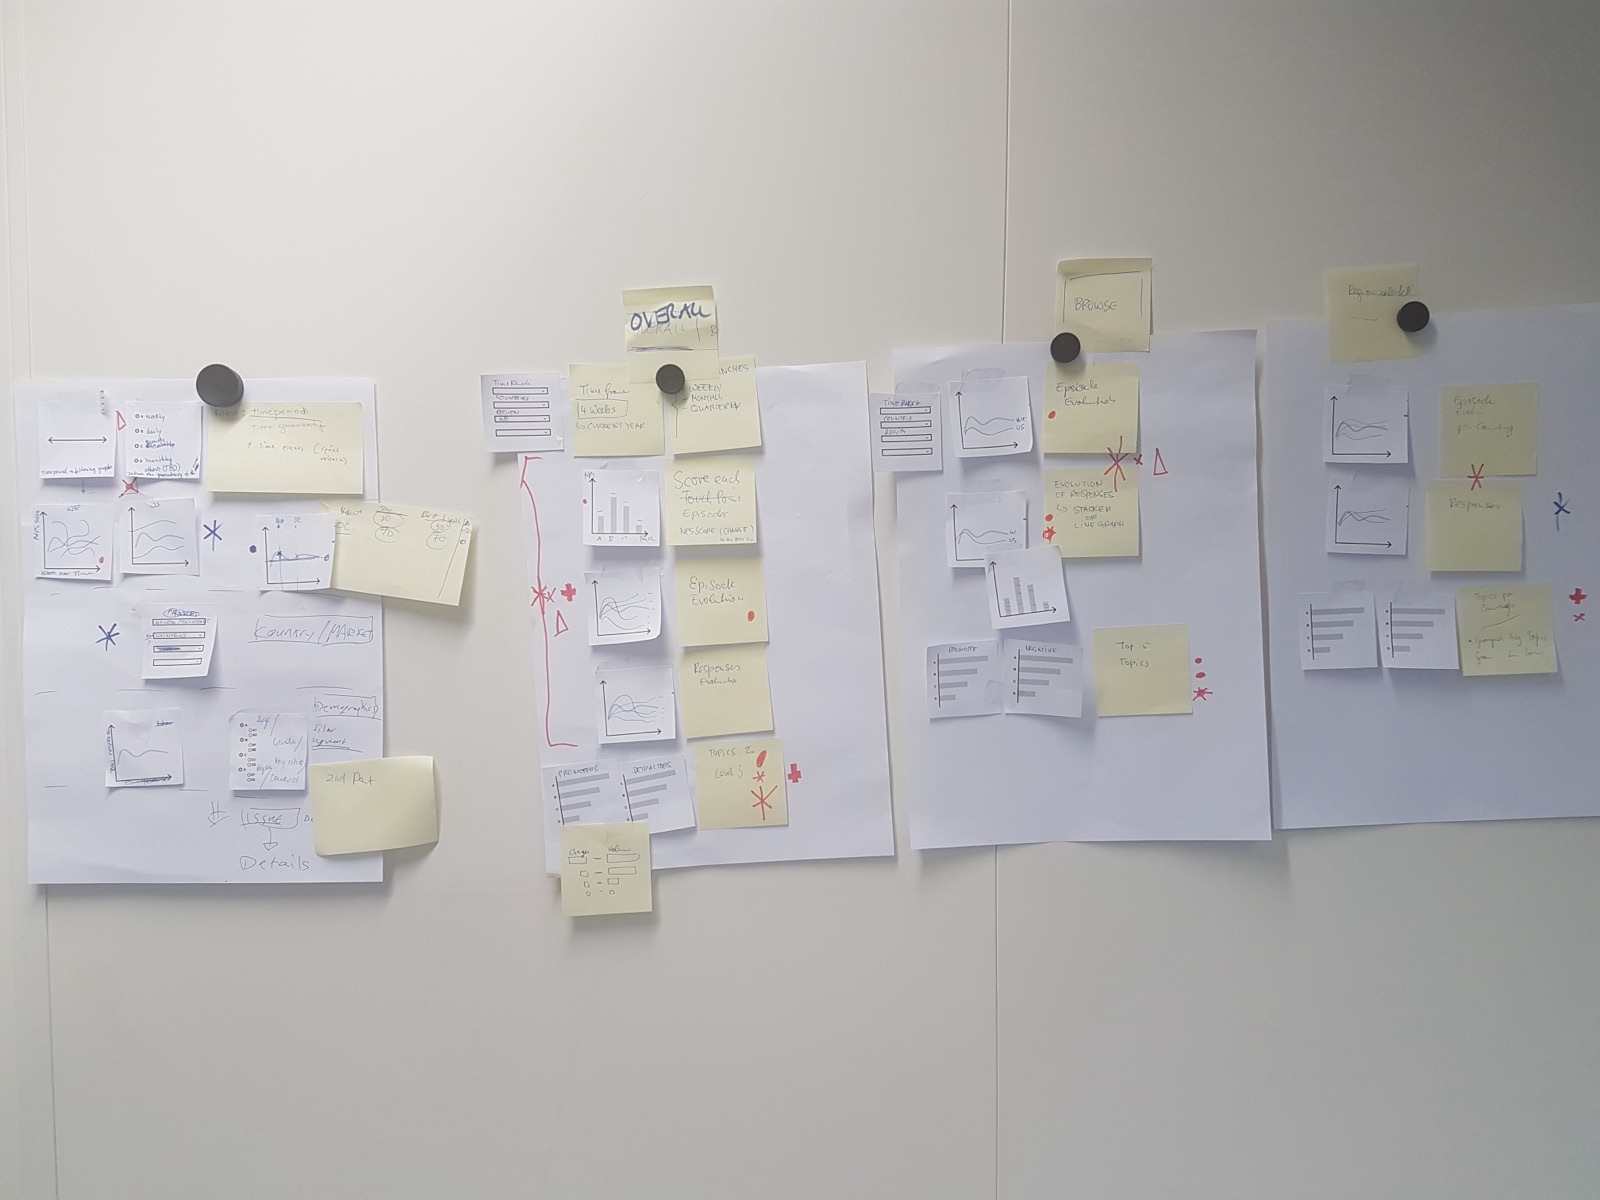
Context scenarios tell stories about users’ future activities as they happen in context. A good scenario makes it easy to envision experience flows and the architecture the system needs.
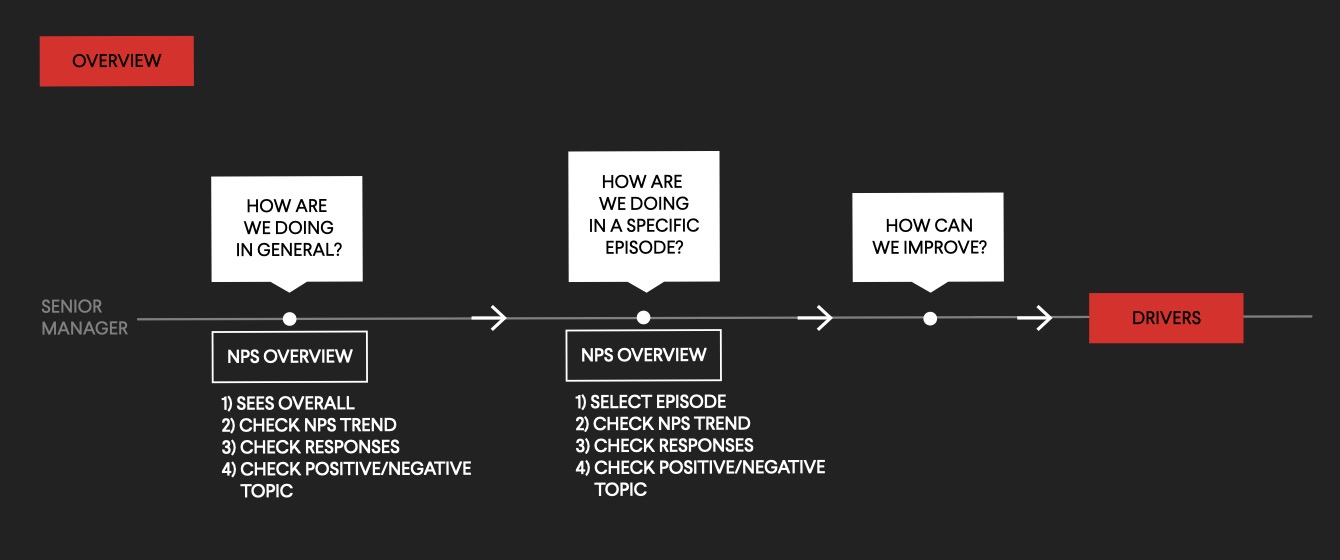
1 · Overview
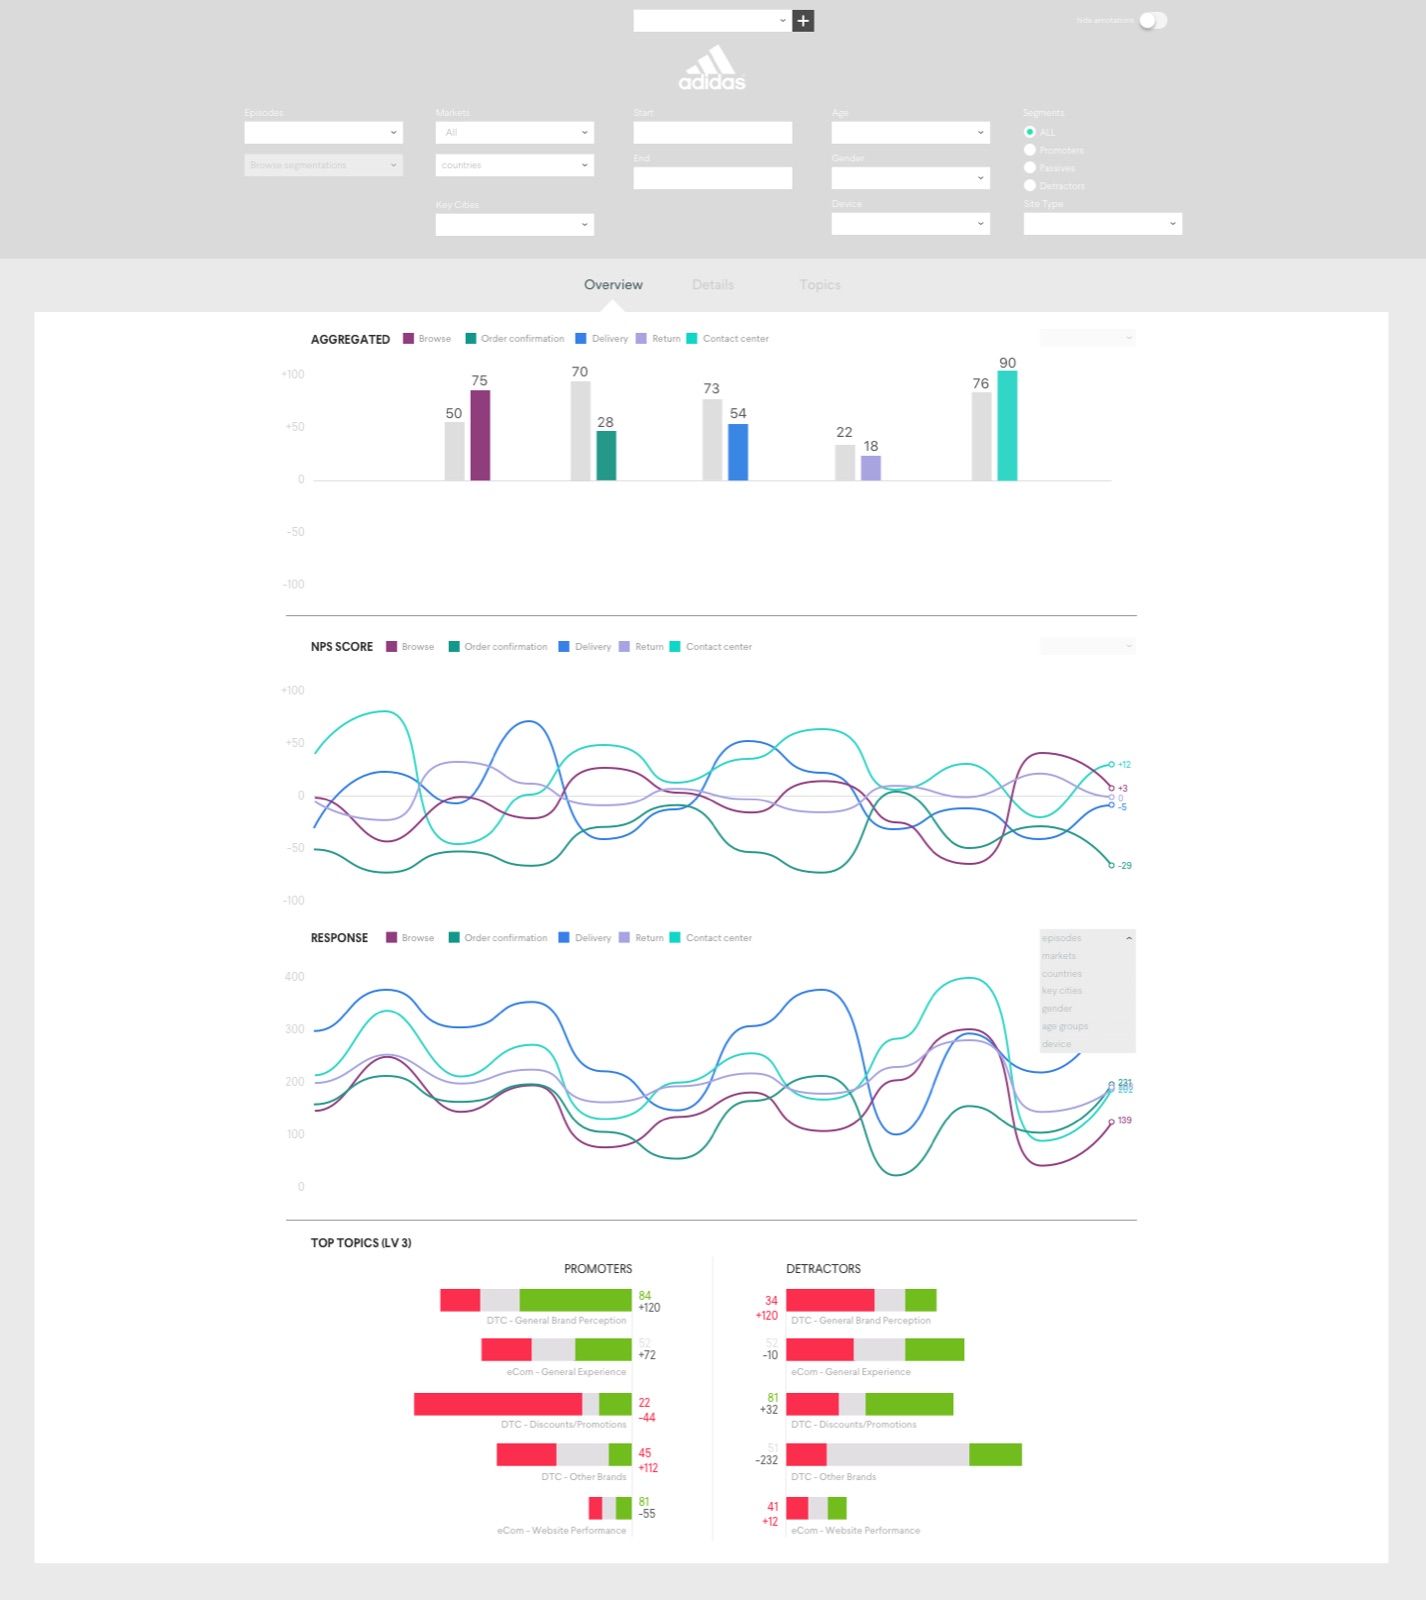
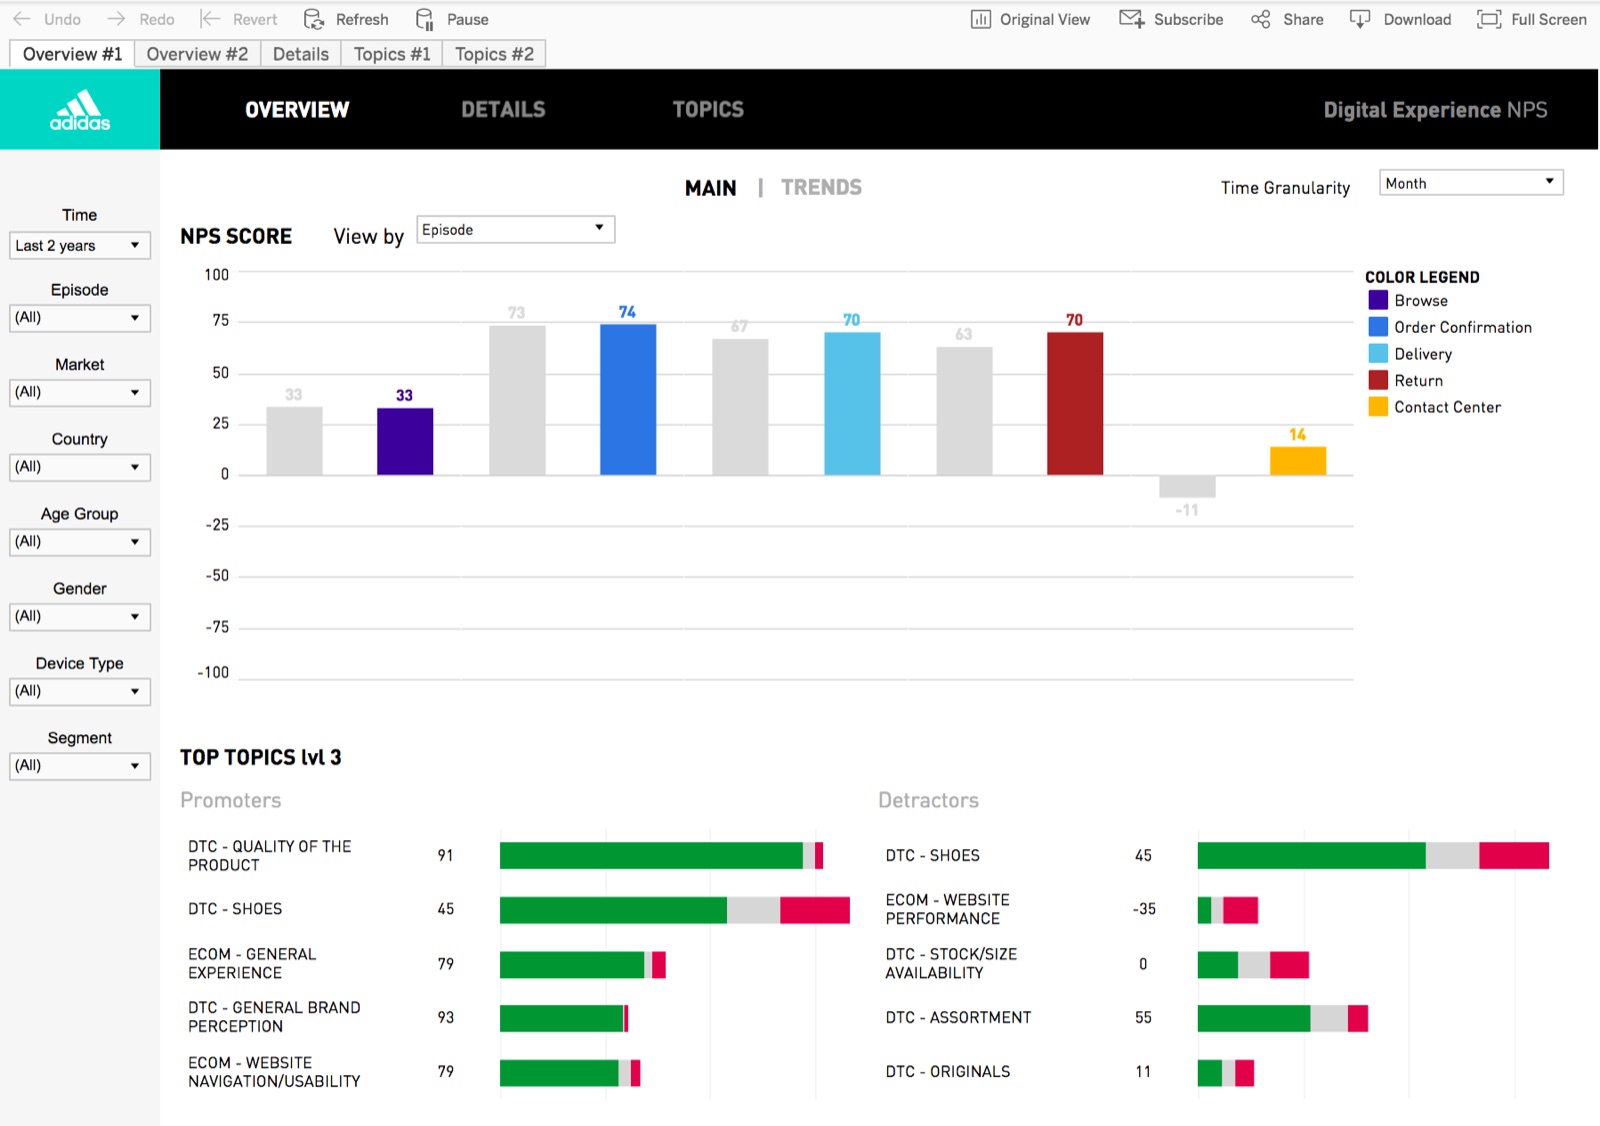
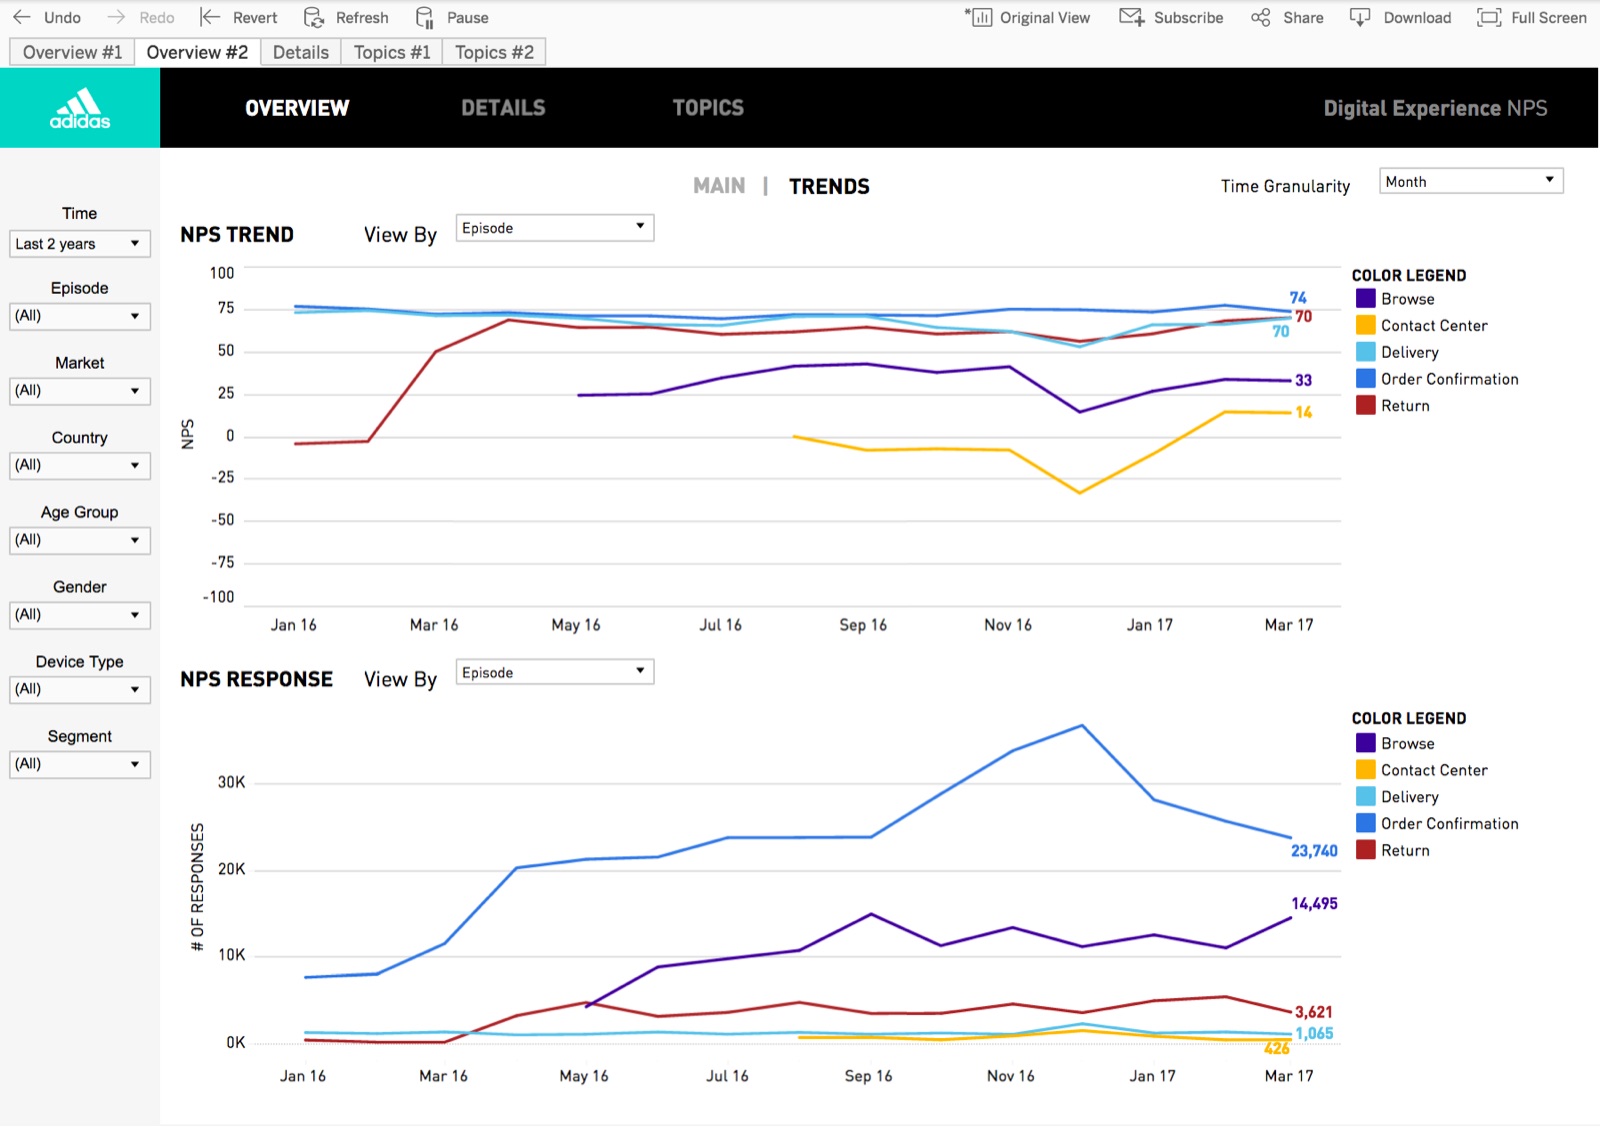
Amanda has to prepare a senior leadership meeting. She wants to give an overview of the current global NPS situation and highlight how the different episodes are doing.
2 · Drivers
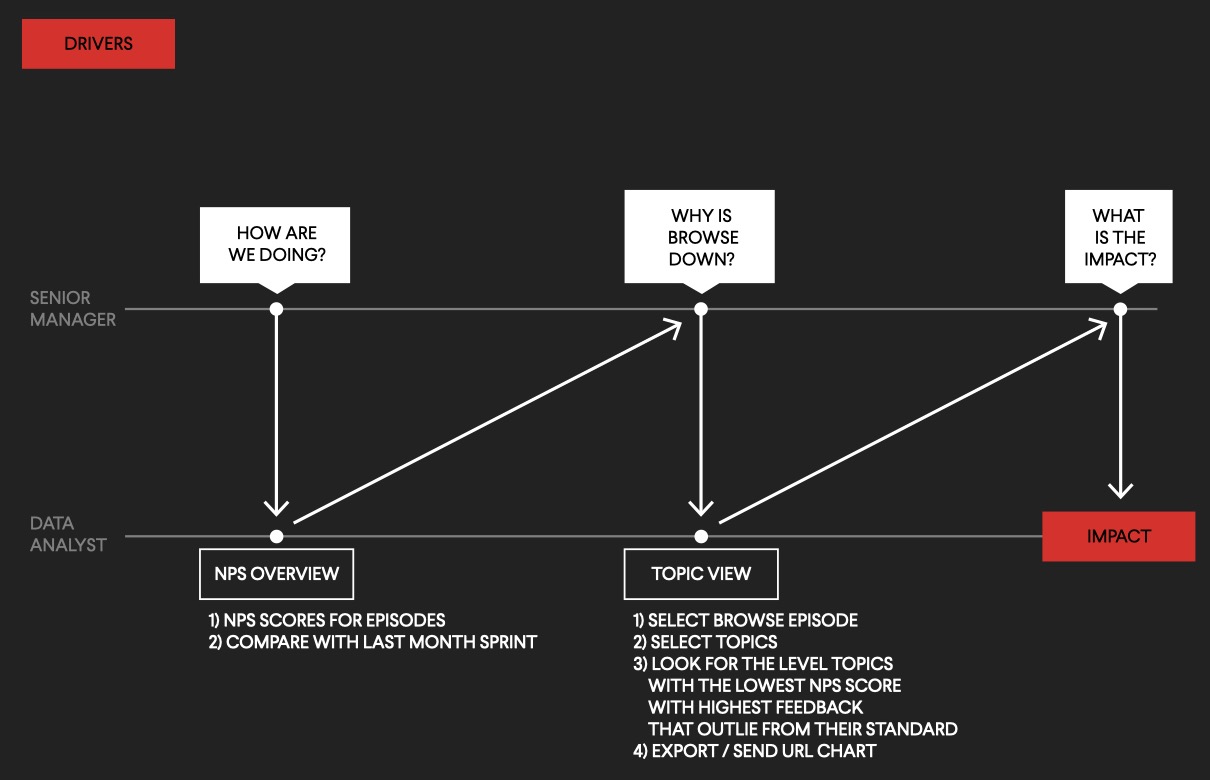
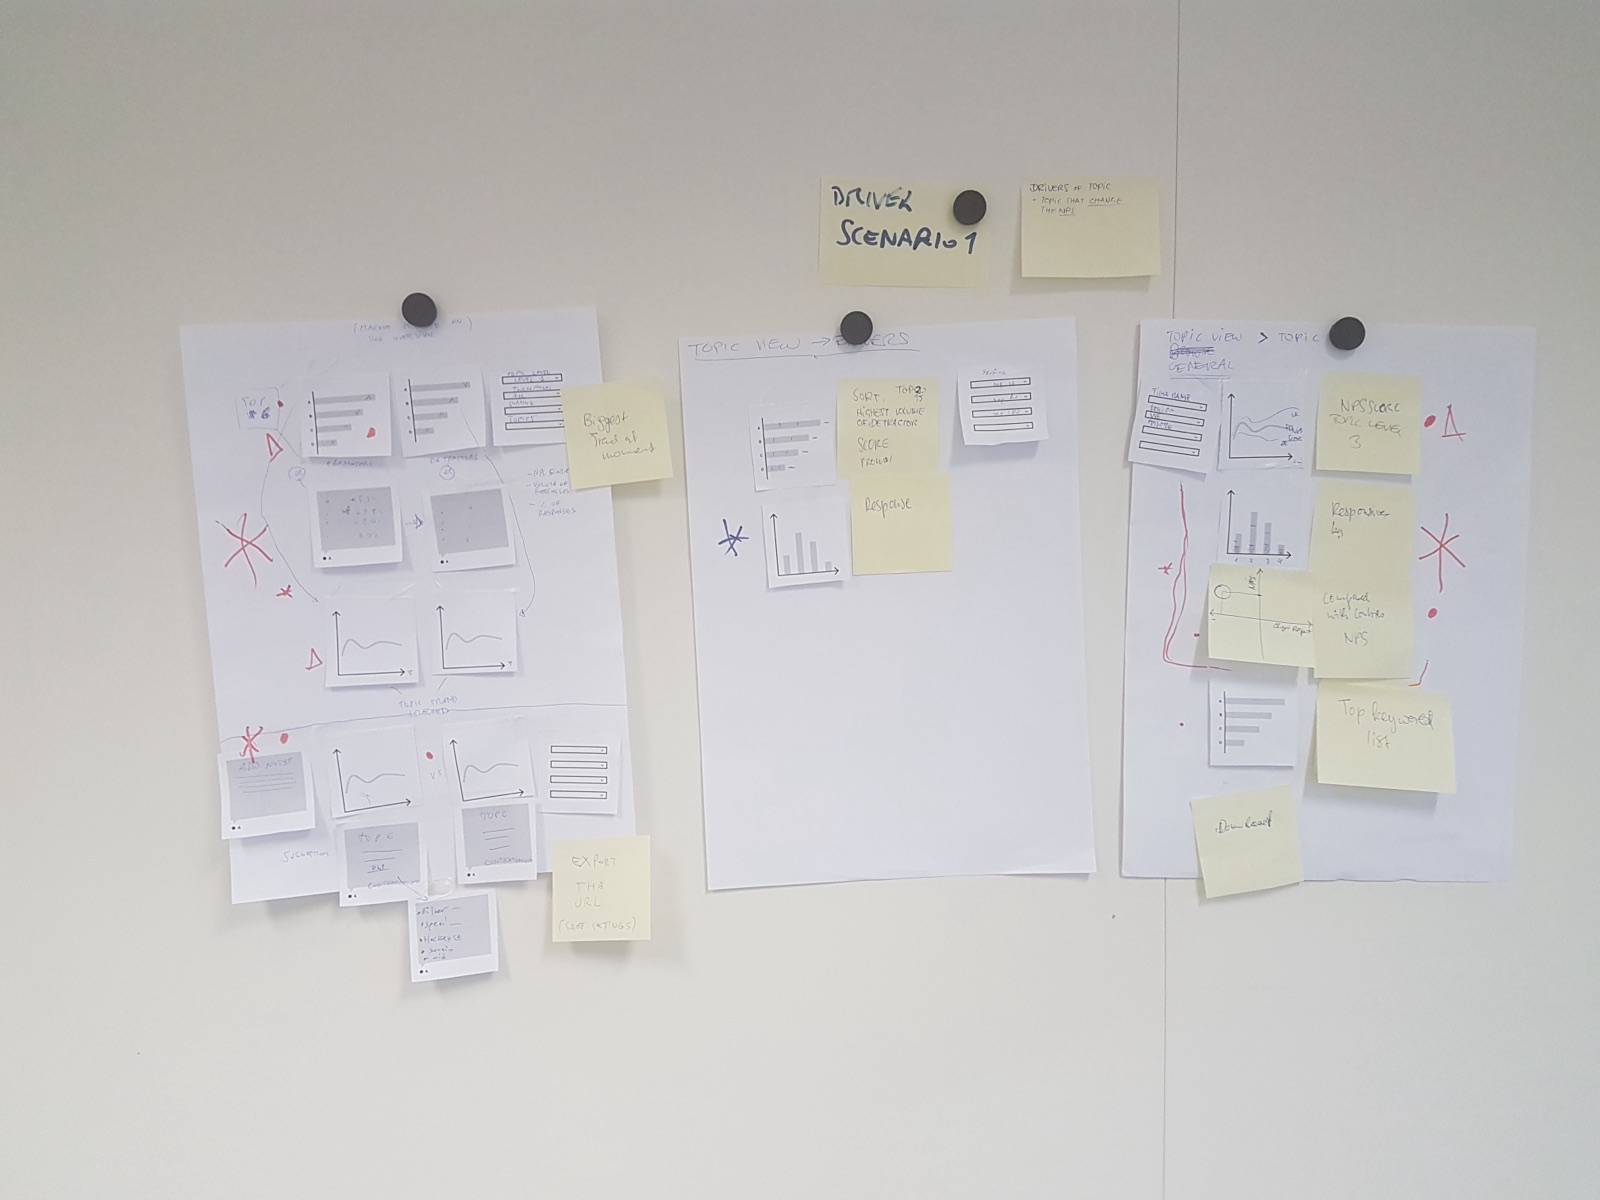
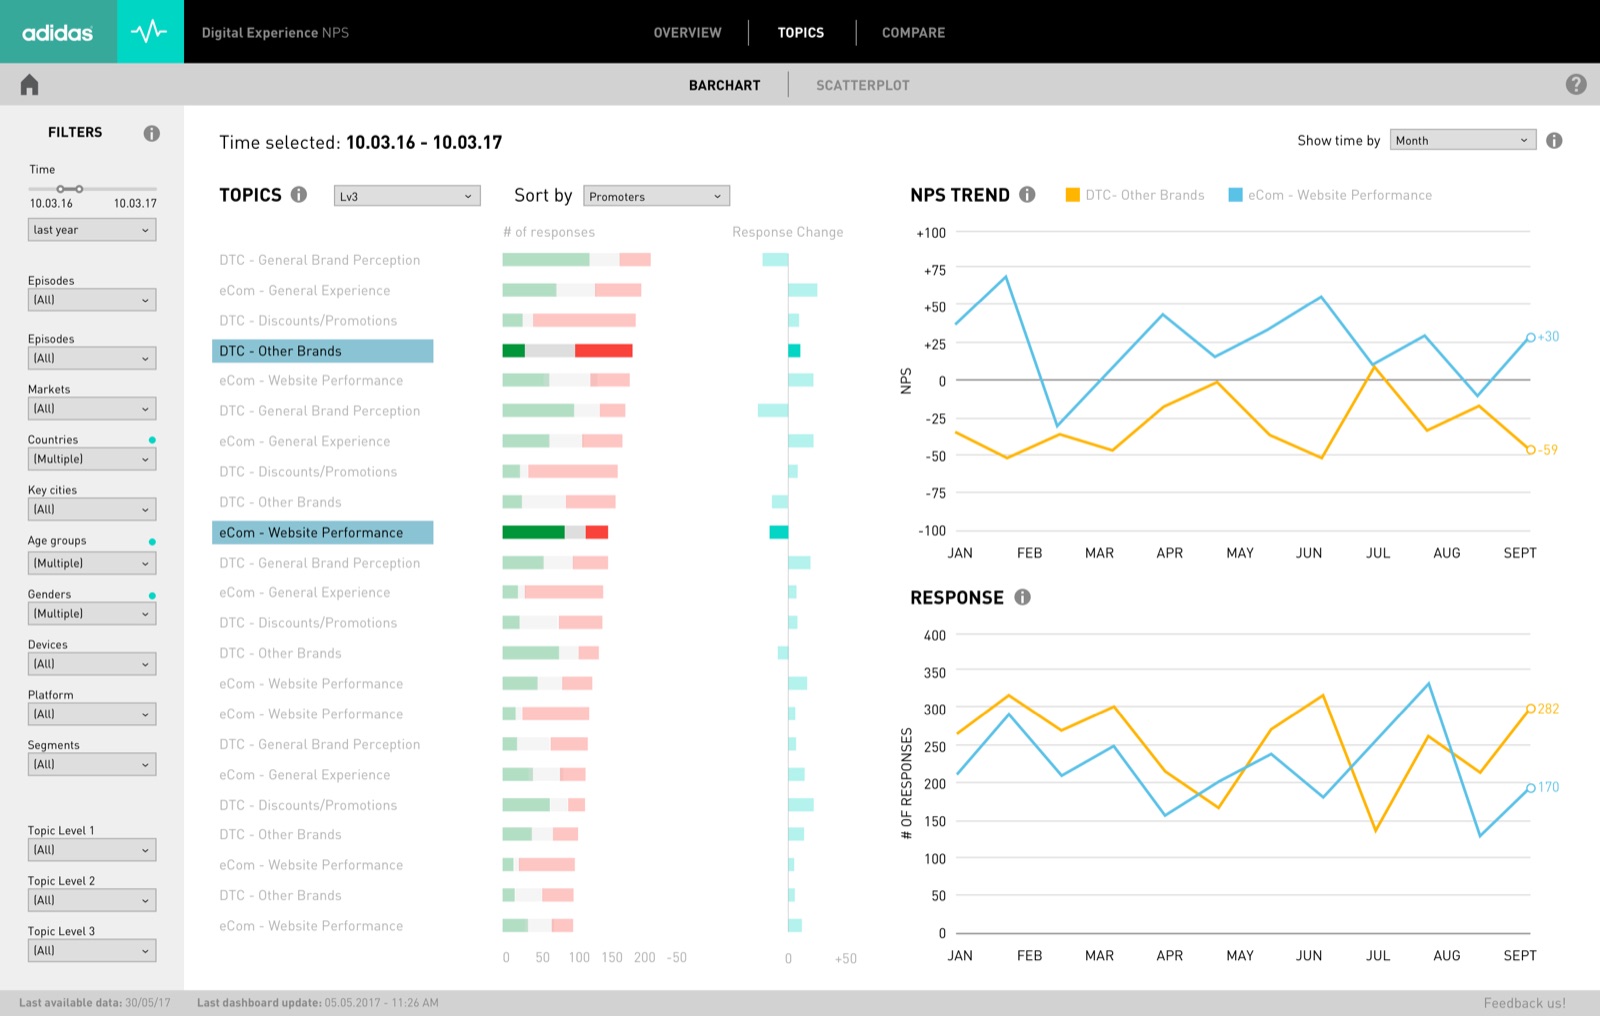
Amanda is looking for improvements to the Browse experience in Western Europe. She asks Gurjyot to find the drivers pushing the score down. He starts from the episode overview, then digs into the topic view, looking for level-3 topics with the lowest scores and the most feedback — then checks their impact or hands it back to Amanda.
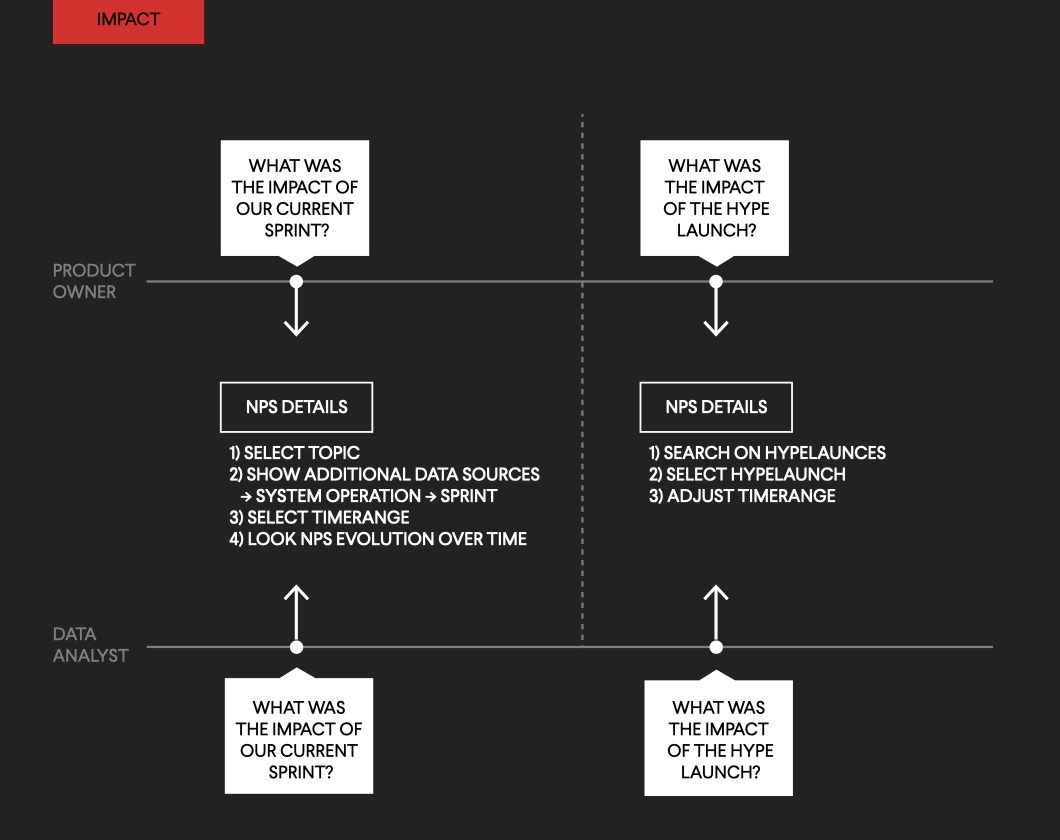
3 · Impact
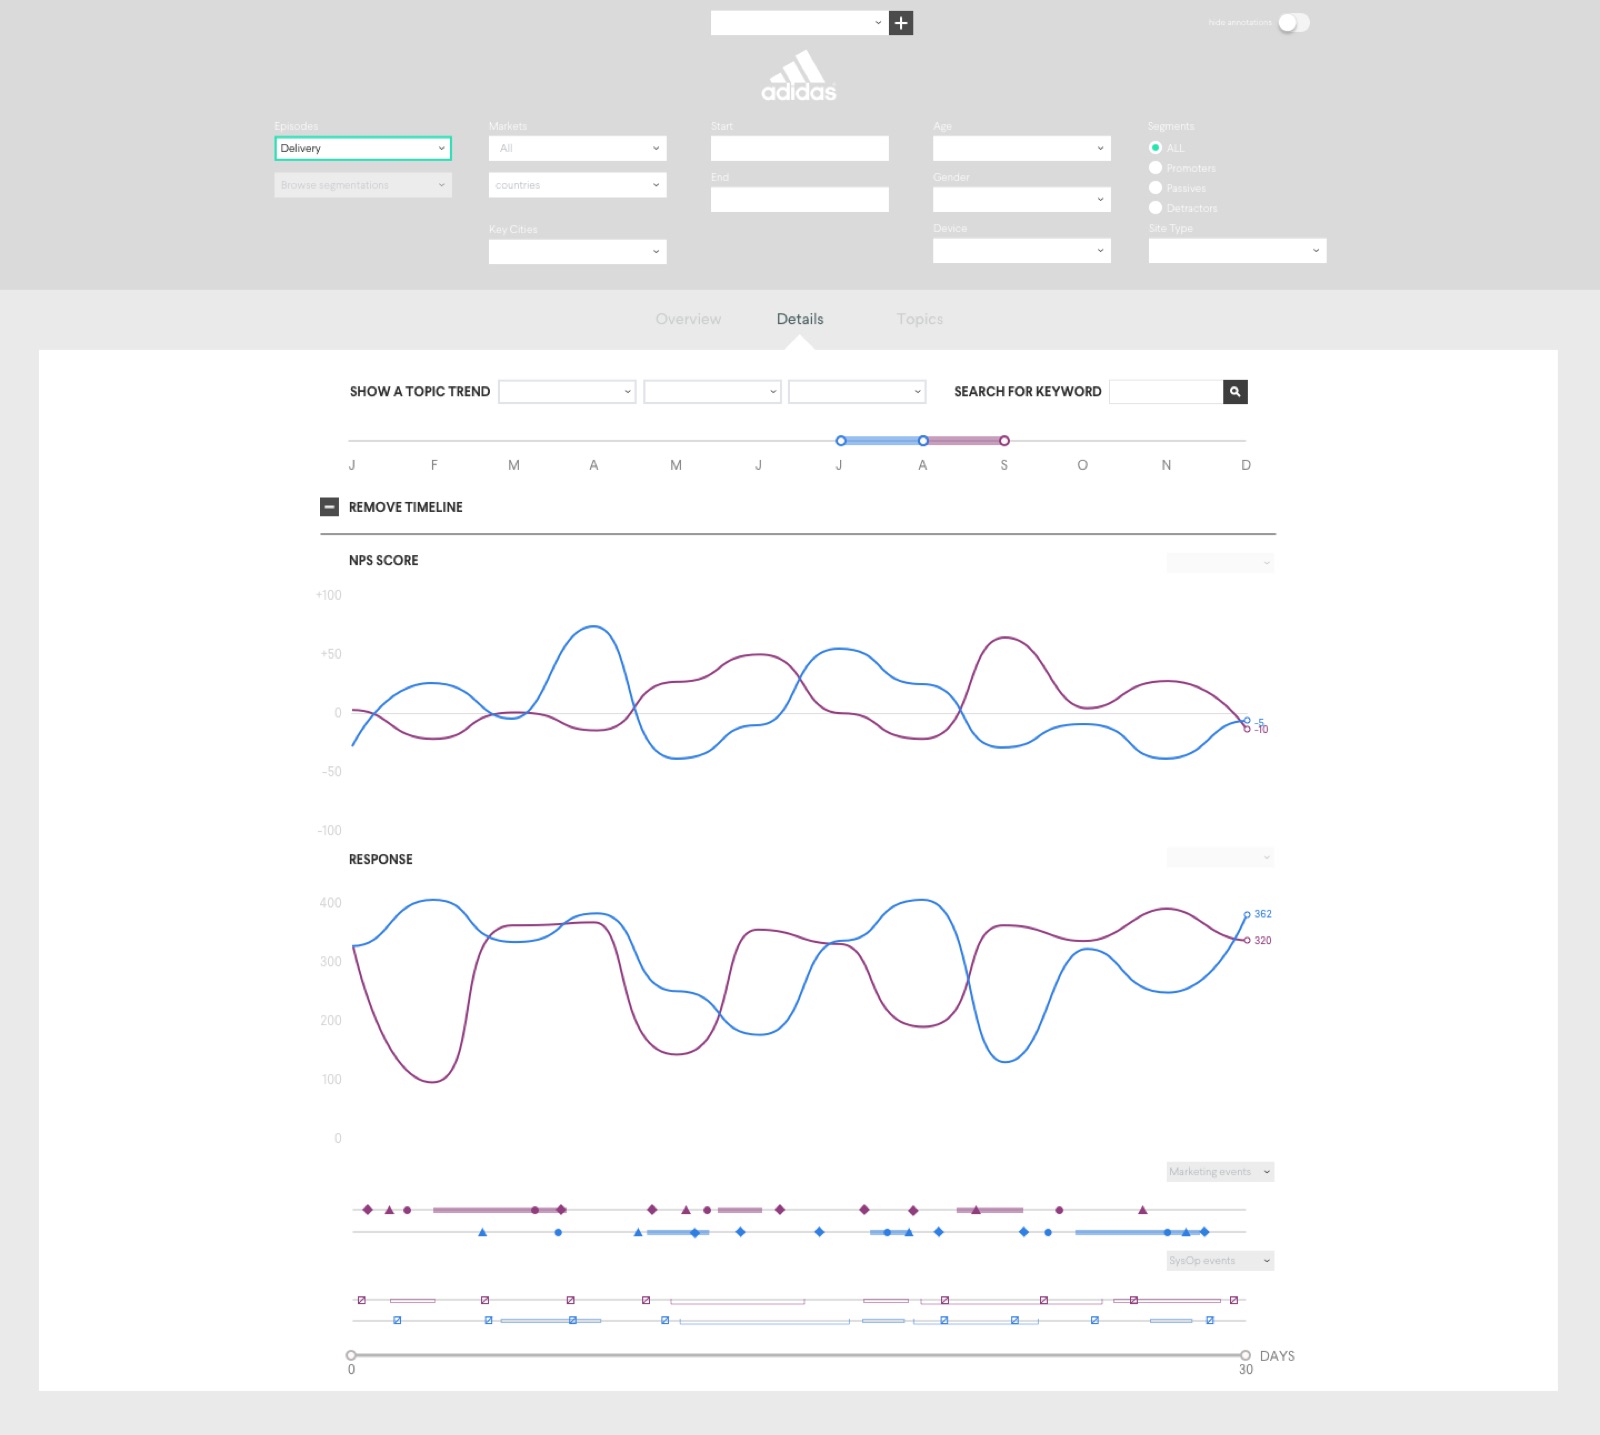
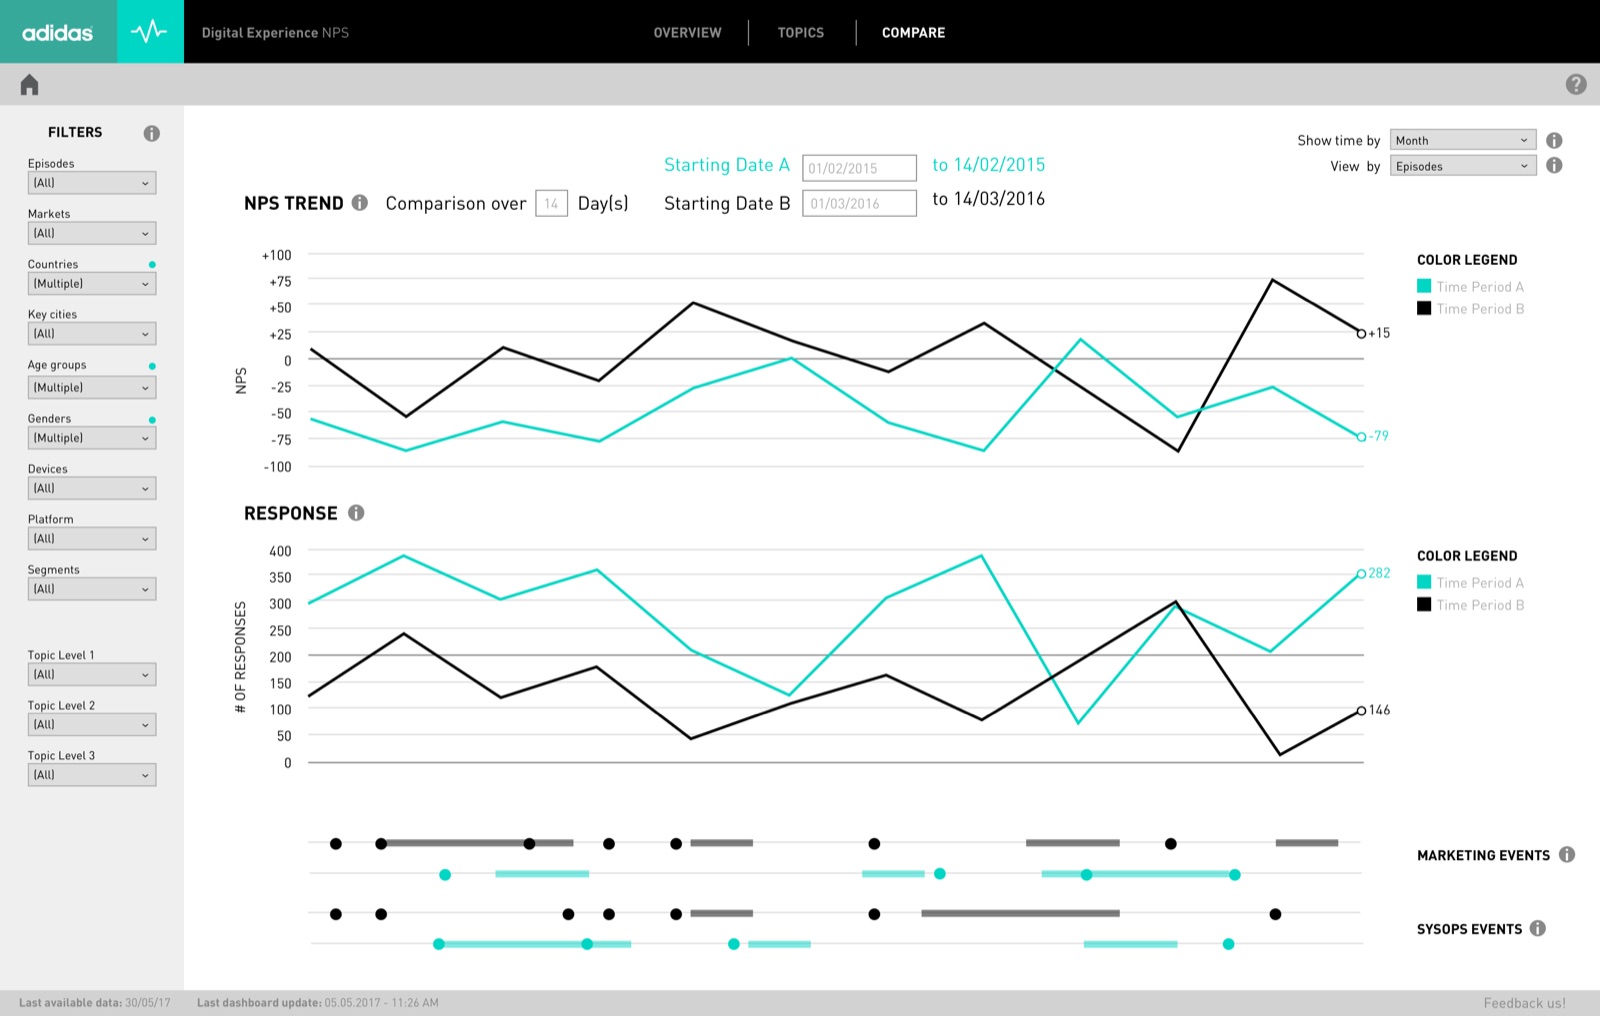
Amanda and Gurjyot look at how events changed the NPS of the Browse touchpoint, using extra data — marketing events and system operation events — over a specific period, to measure their effects.
The model
Effect
The NPS score — how are we doing?
Cause
Topics and events — what is behind the score?
Loop
Drivers lead from score to topics; impact leads from events back to the score.
# Ideation
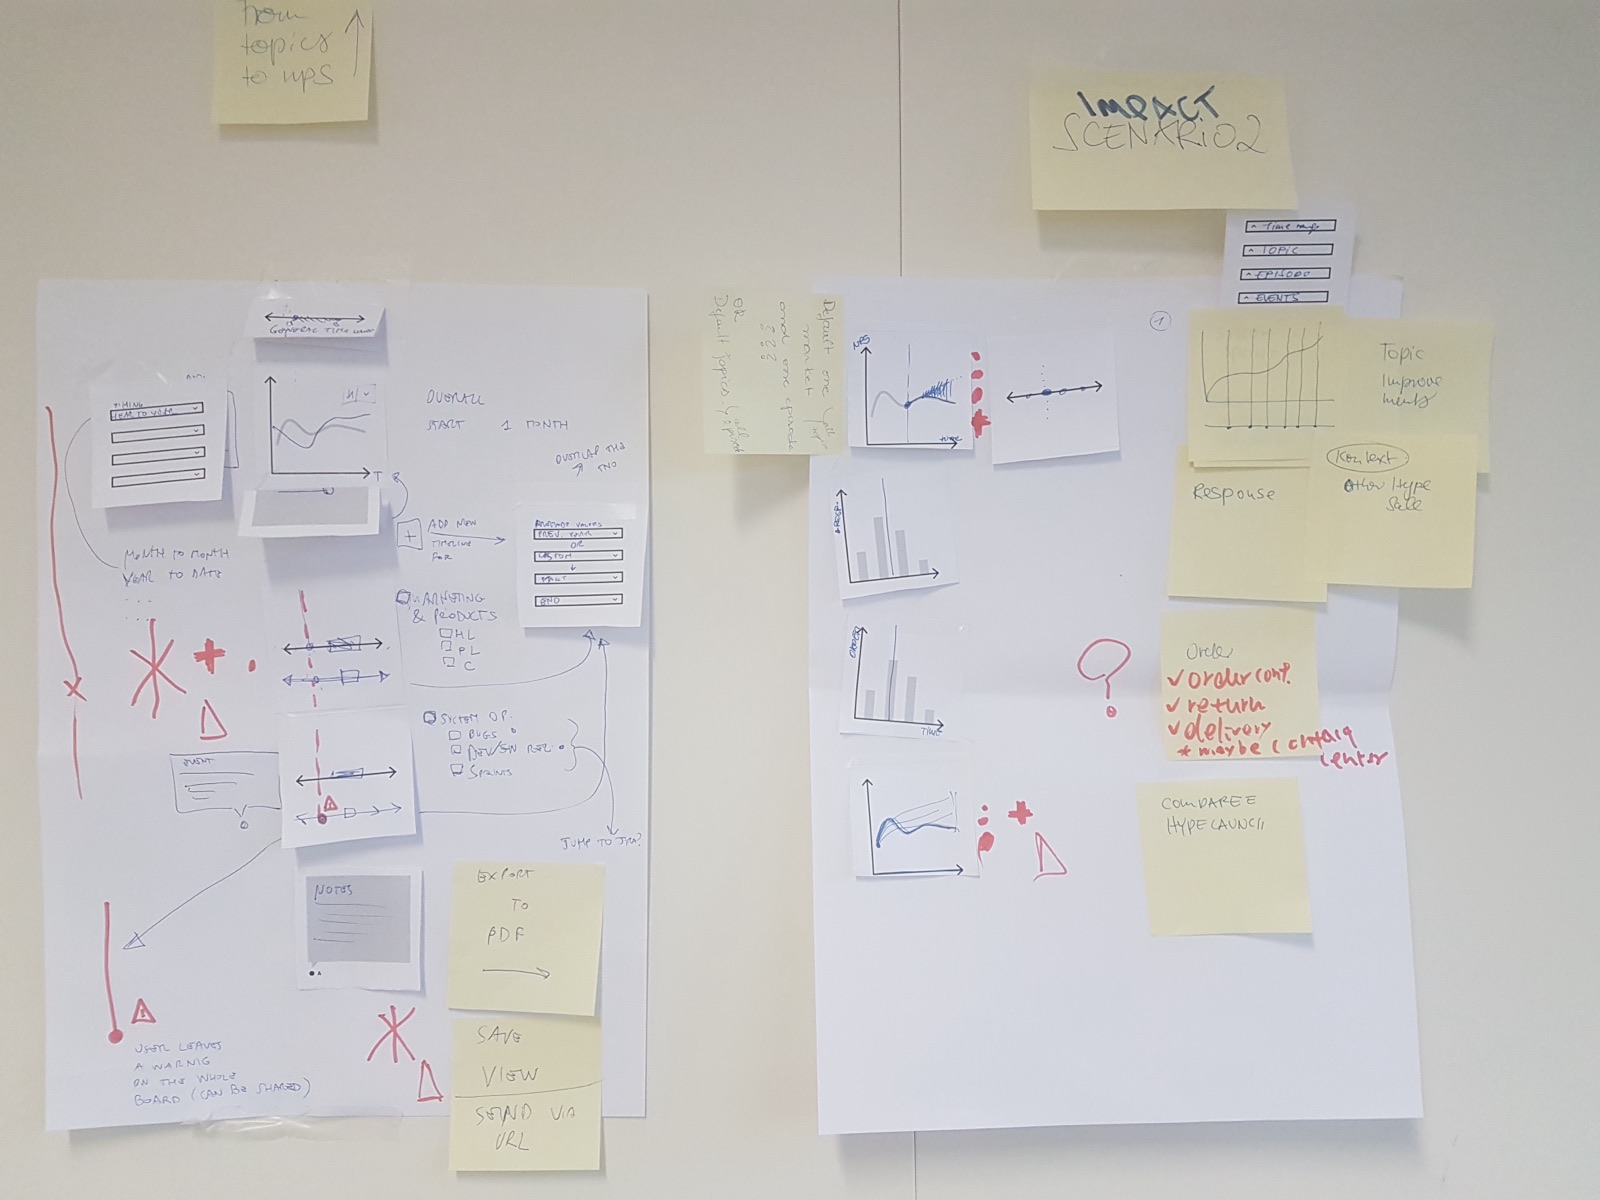
Information architecture
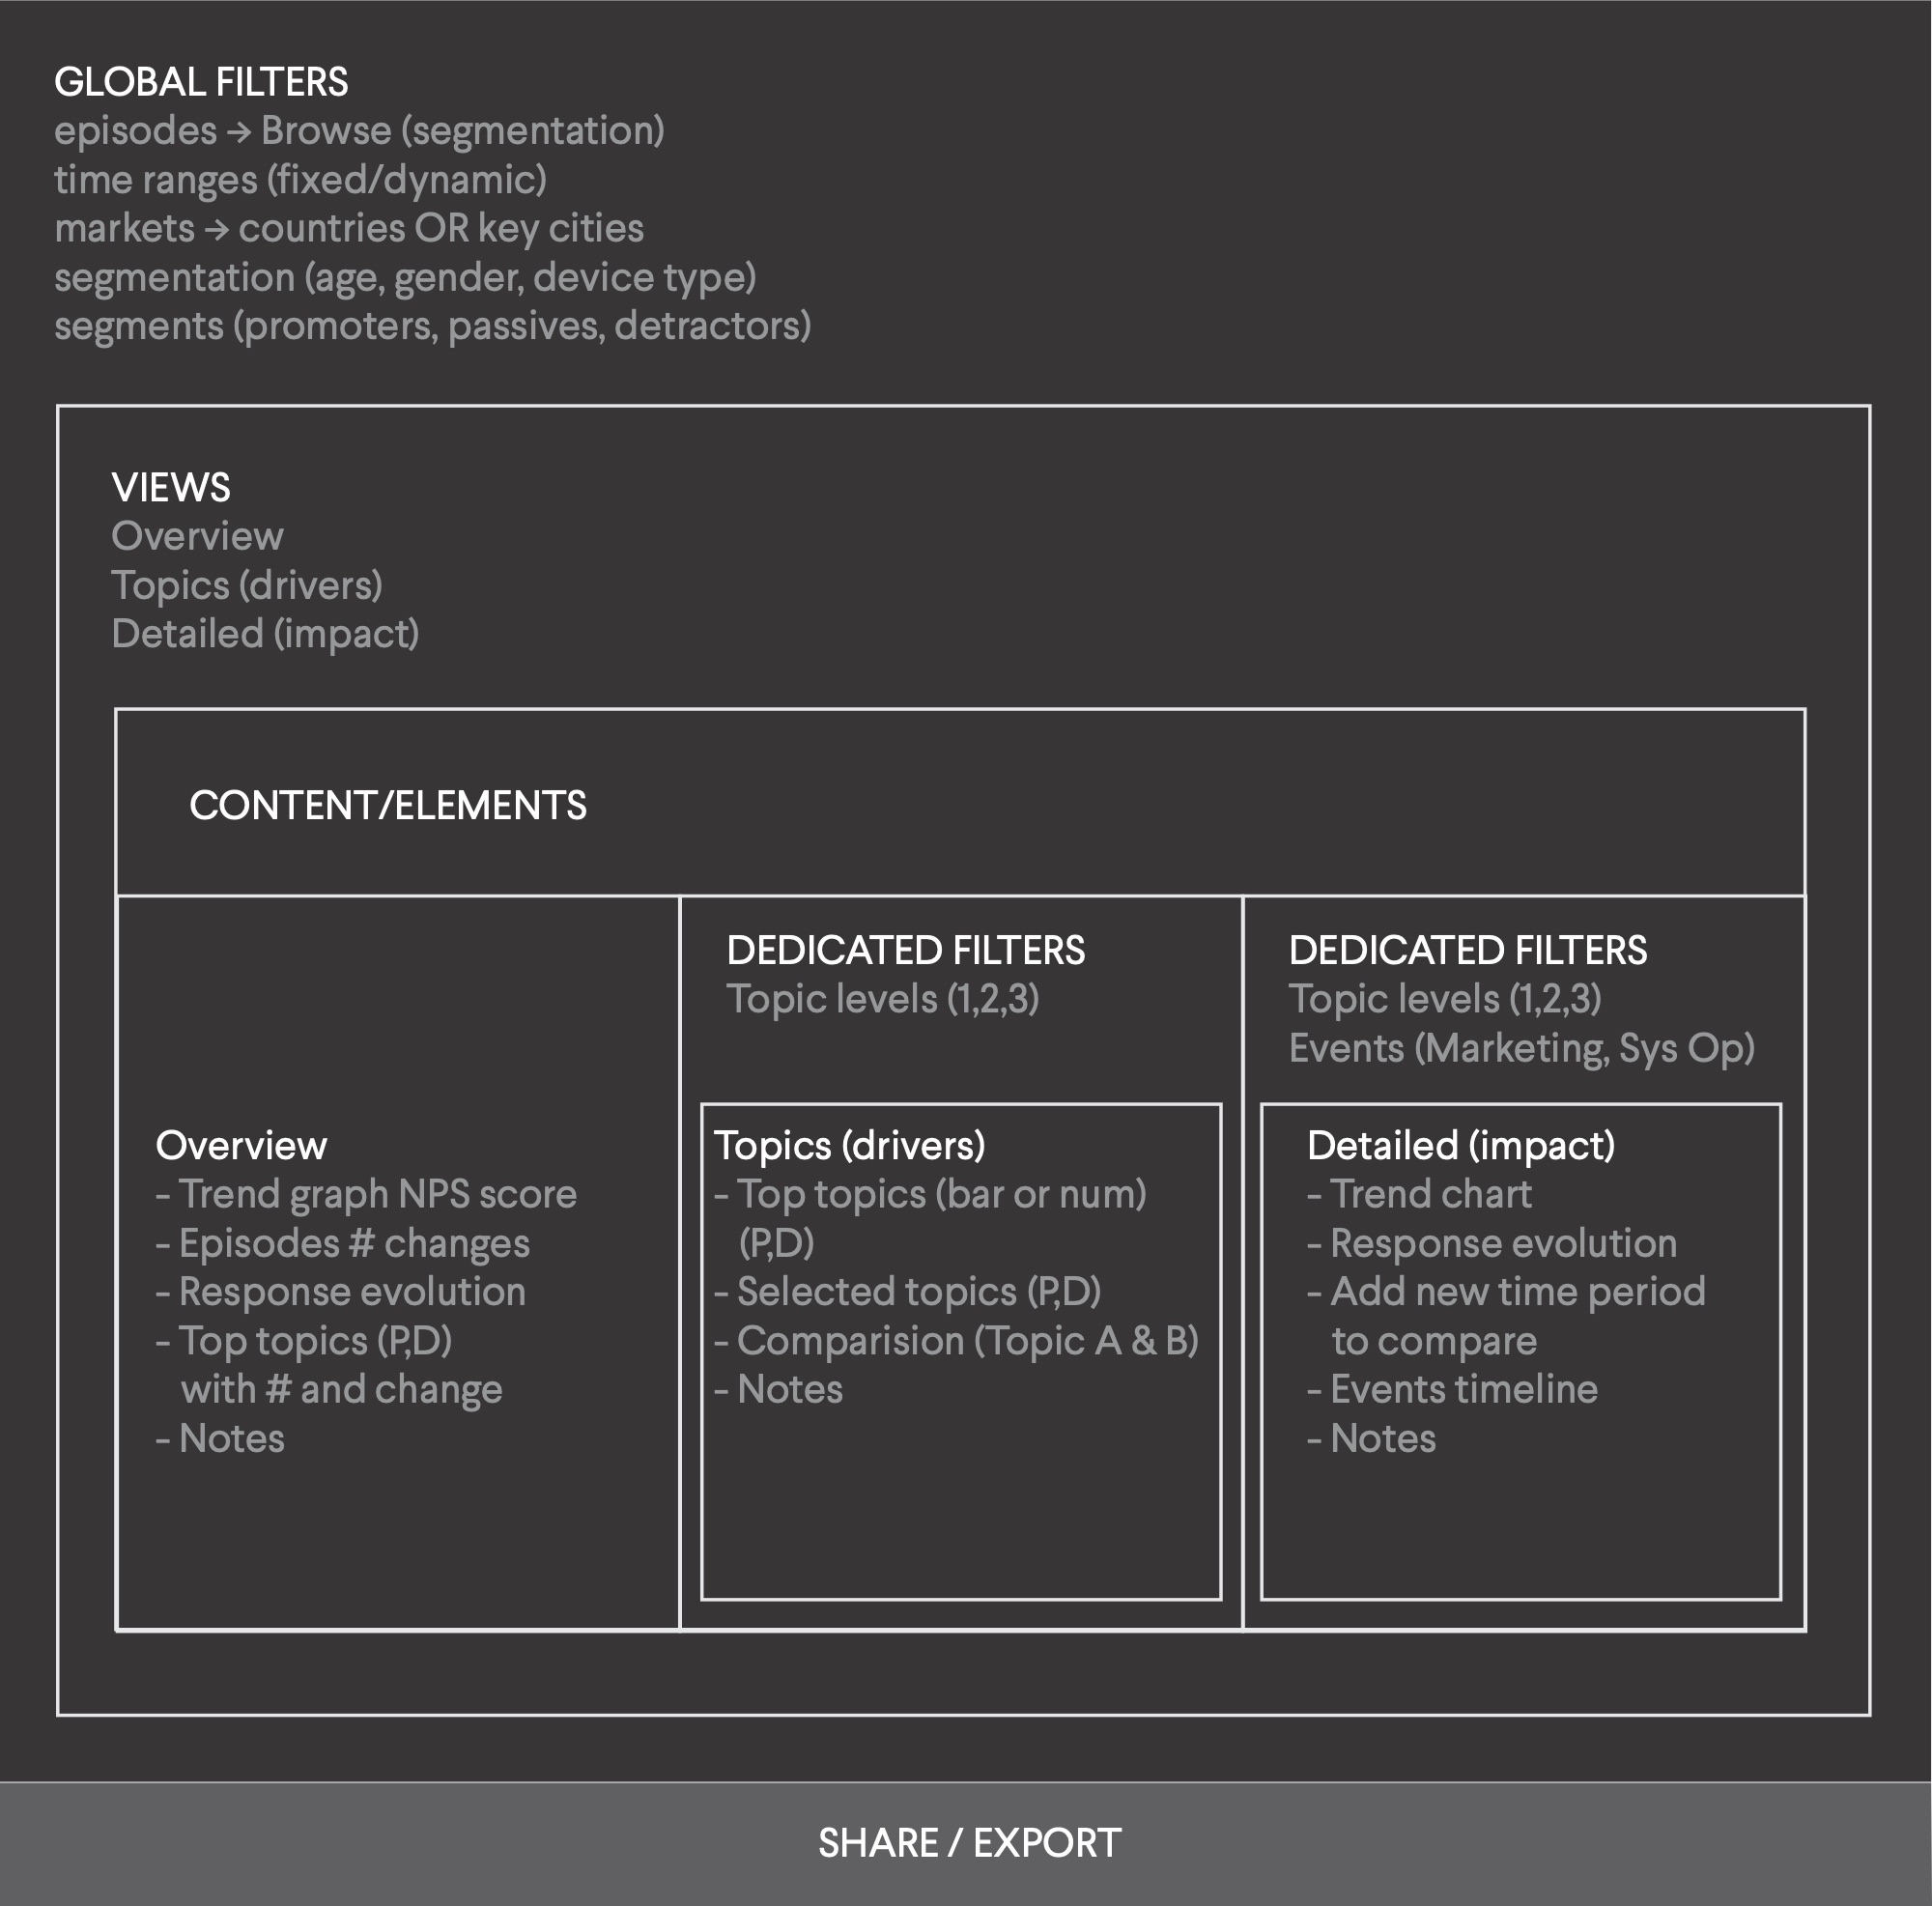
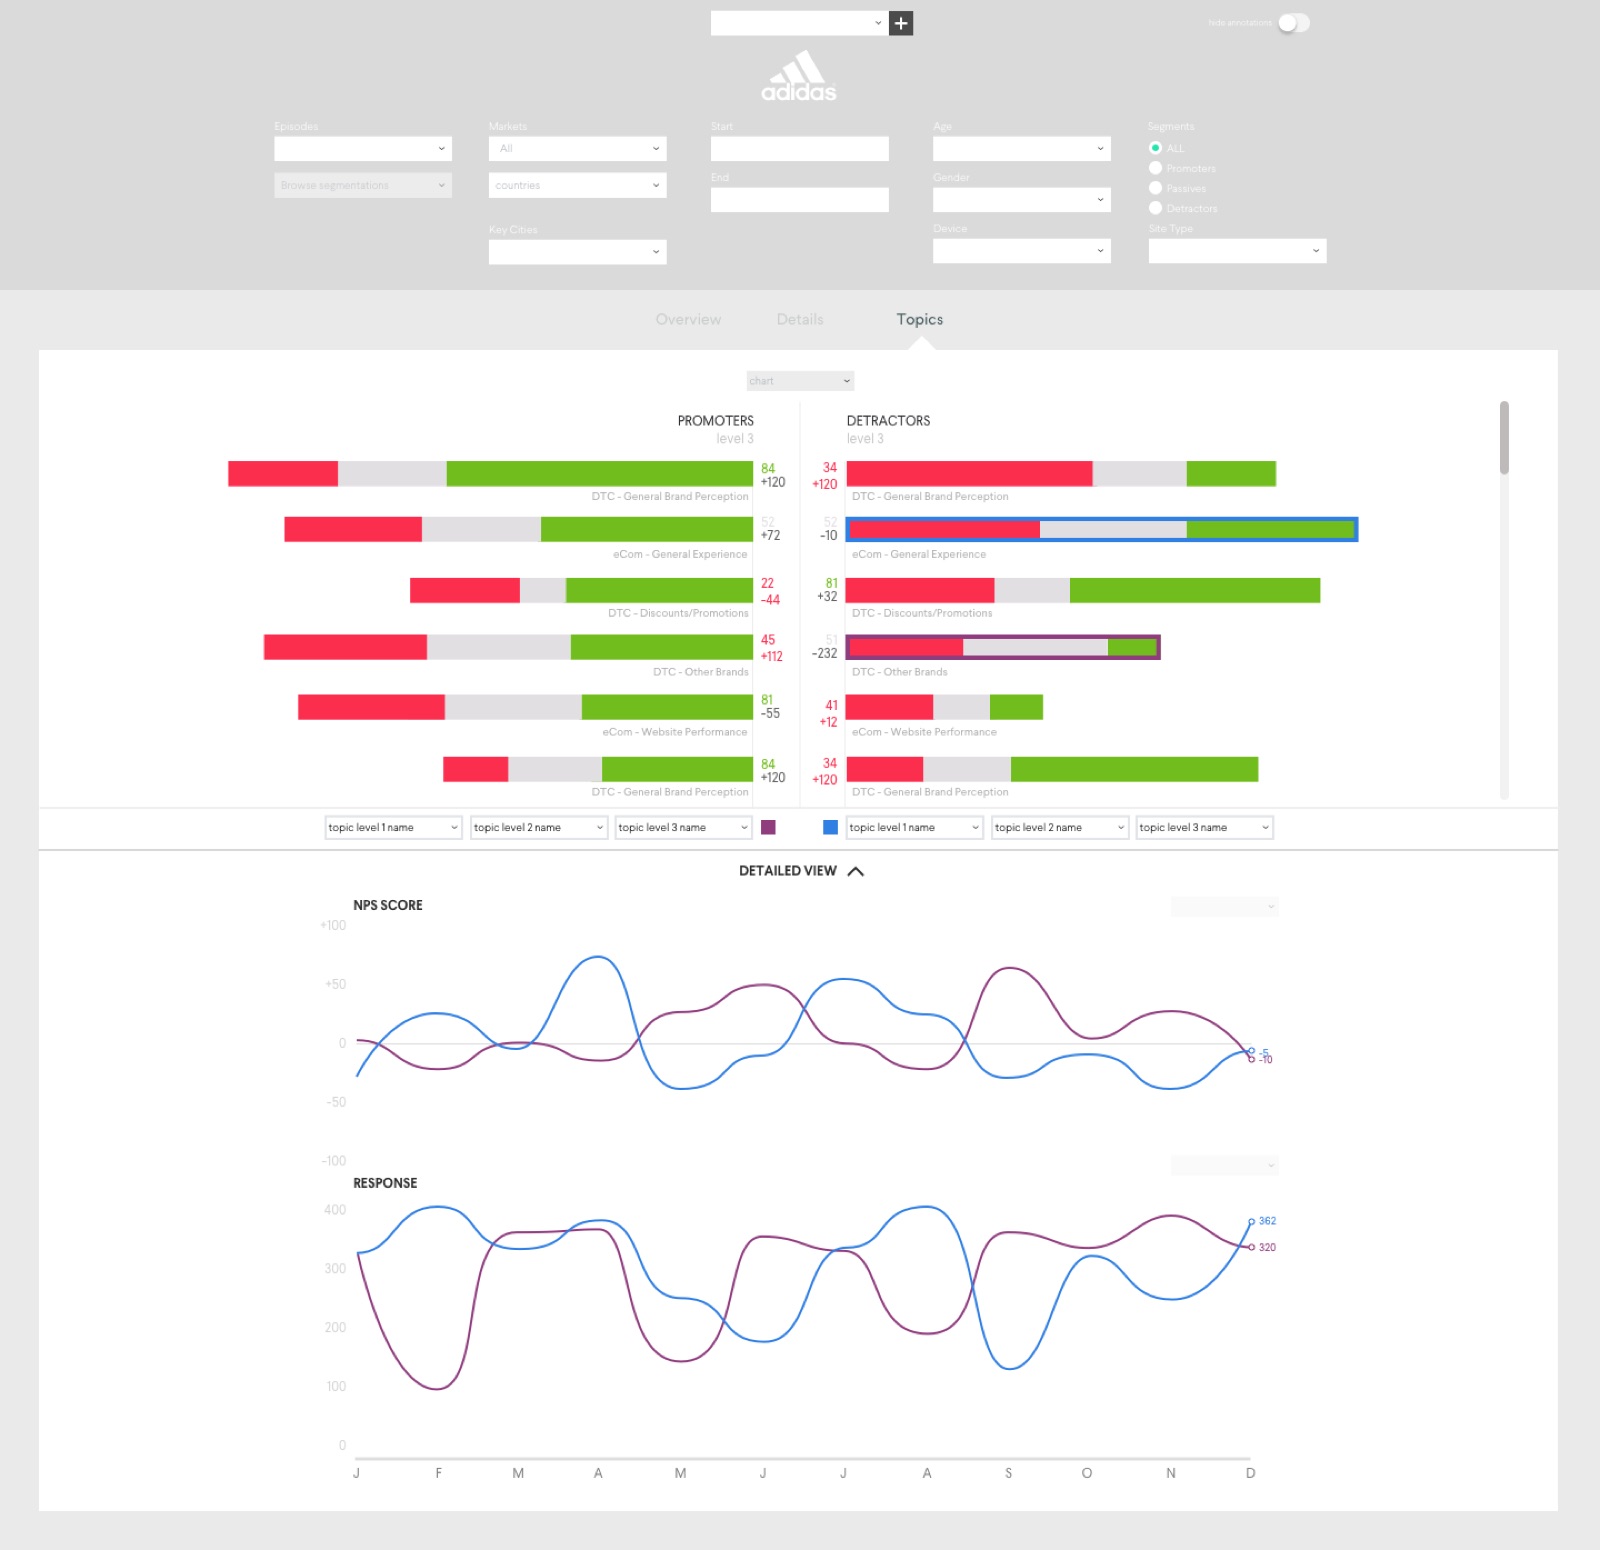
Three views — Overview, Topics (drivers) and Details (impact) — share the same structure.
- Global filters (episode, market, segments, time) apply everywhere
- Dedicated filters refine a single view
- Modules are the content blocks each filter influences
Wireframes
# Testing
A clickable prototype was tested with 12 users over two days — product owners, analysts, NPS champions and marketing — through four task scenarios:
- Overview: prepare a leadership meeting on global NPS, then answer a follow-up on delivery for 20–29-year-olds in the USA
- Details: find which events changed the NPS of a level-3 topic in North America, and compare it with the year before
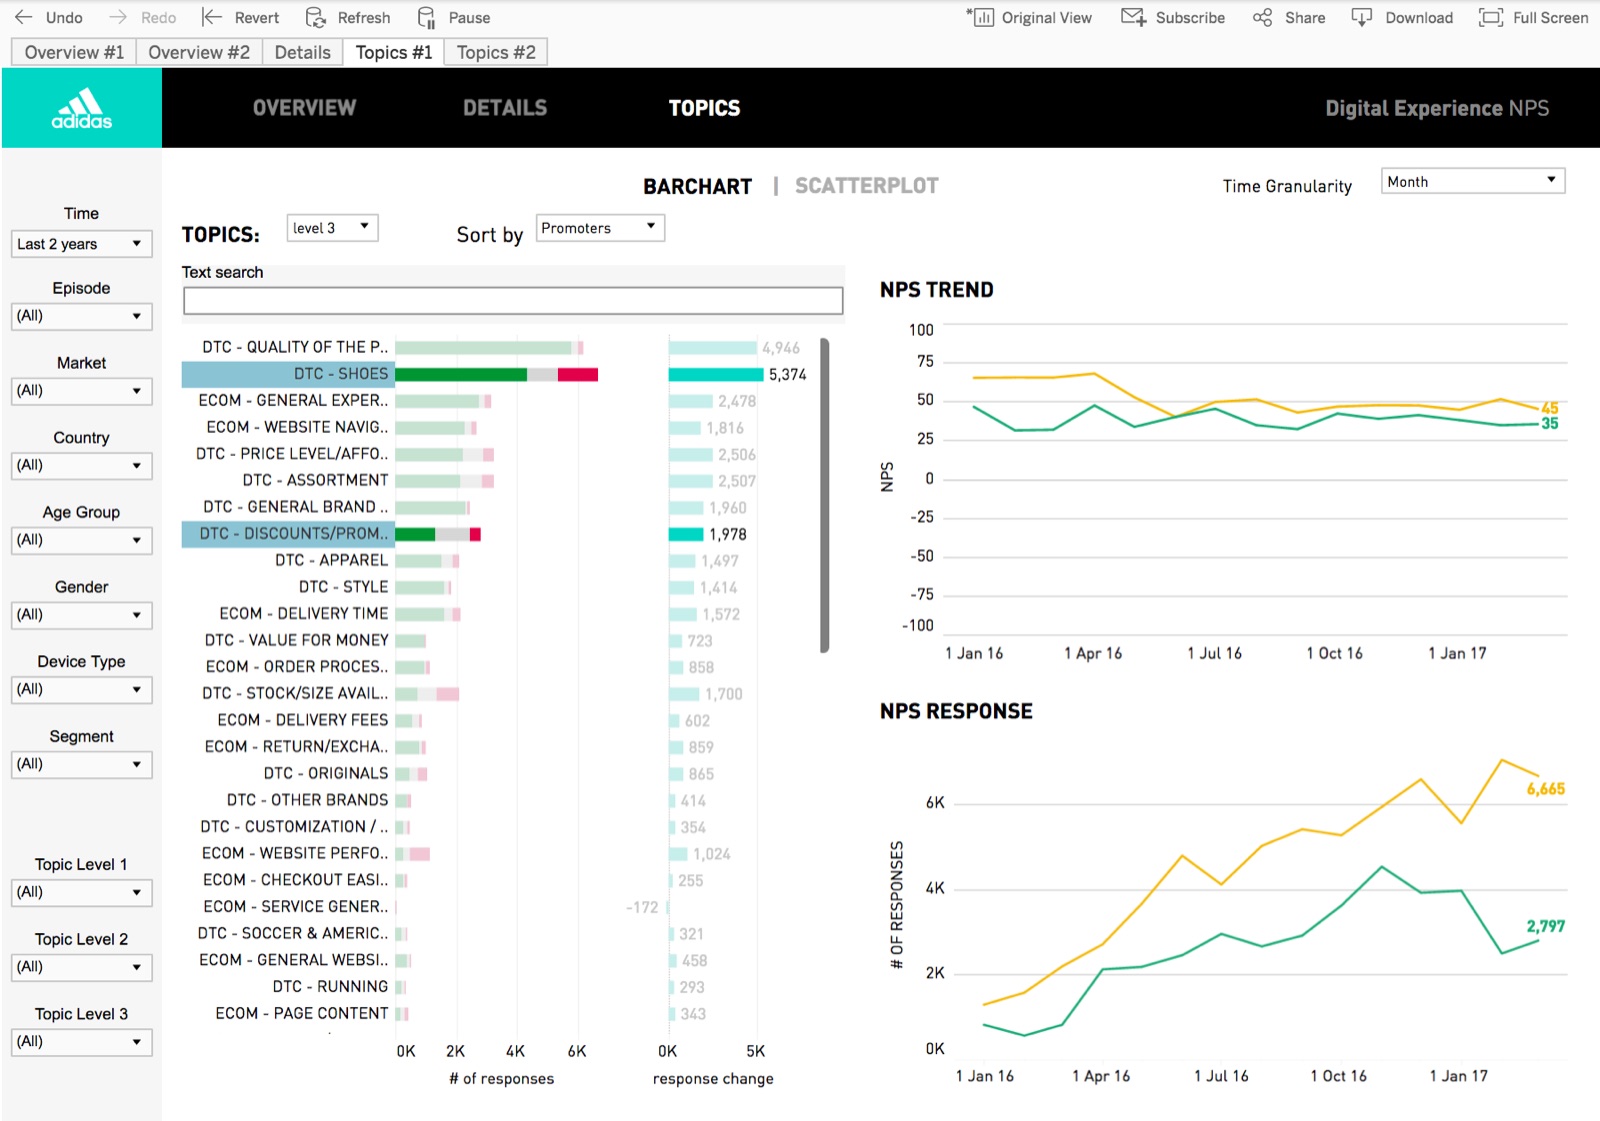
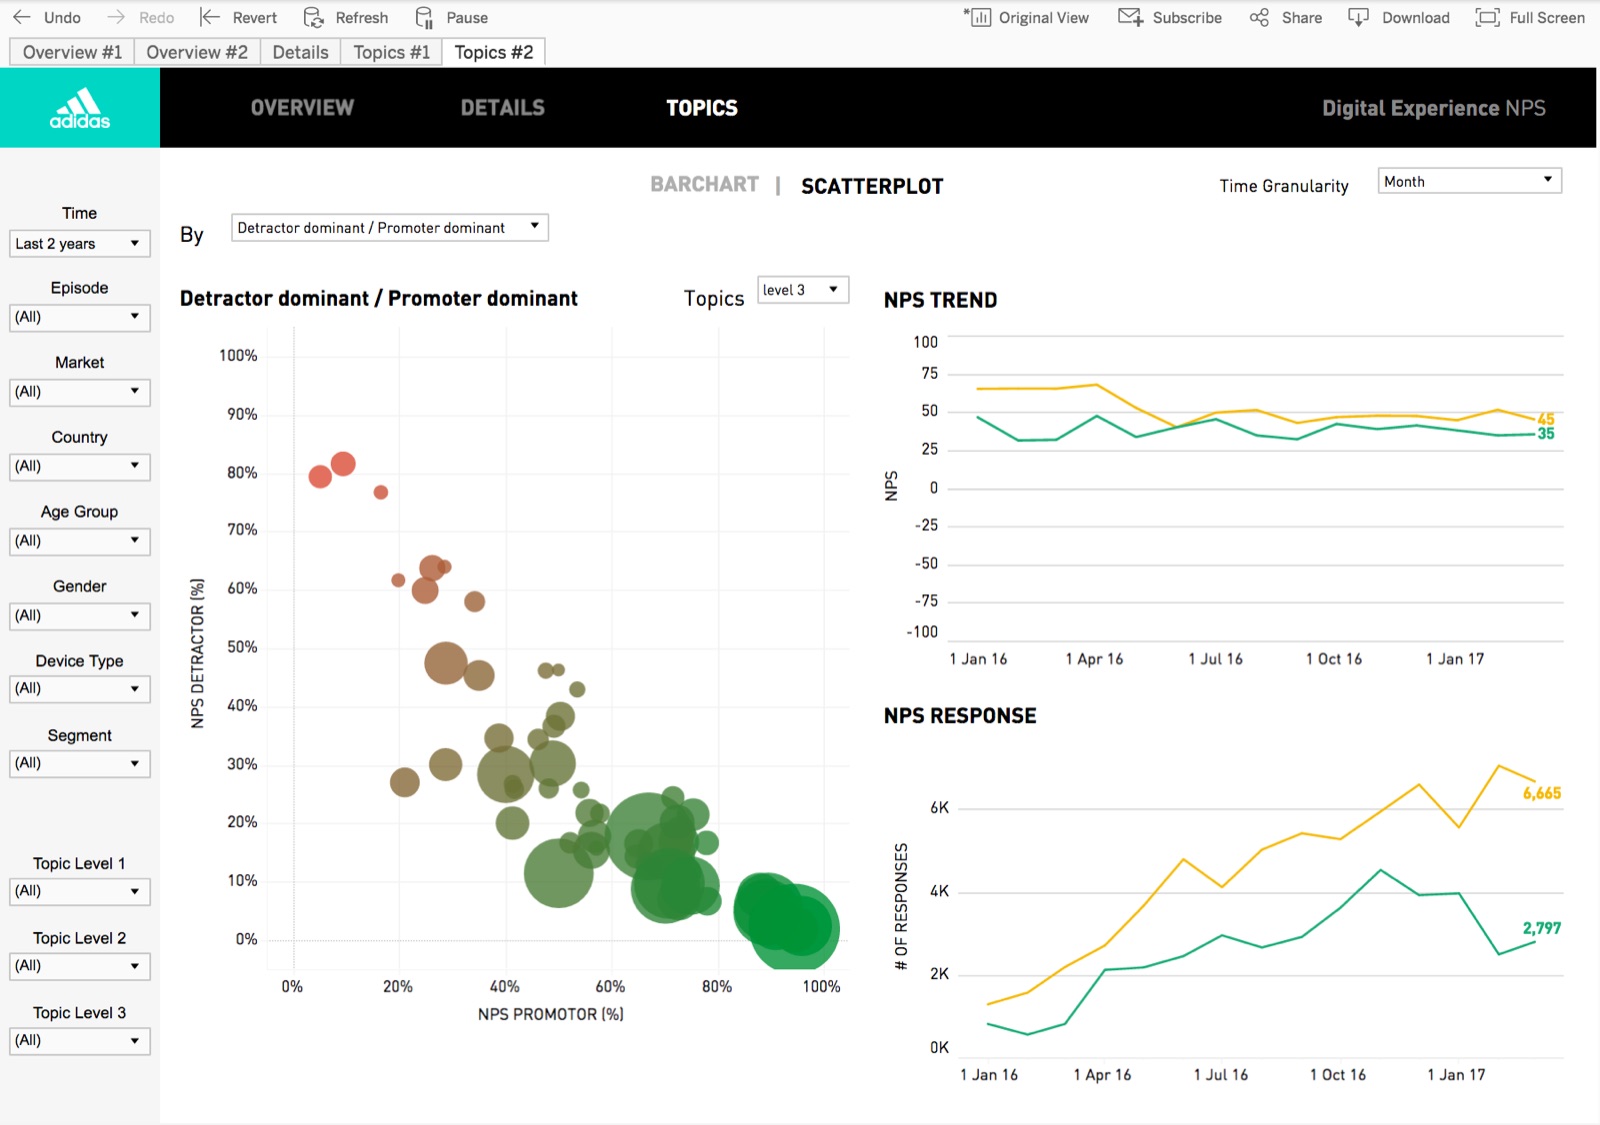
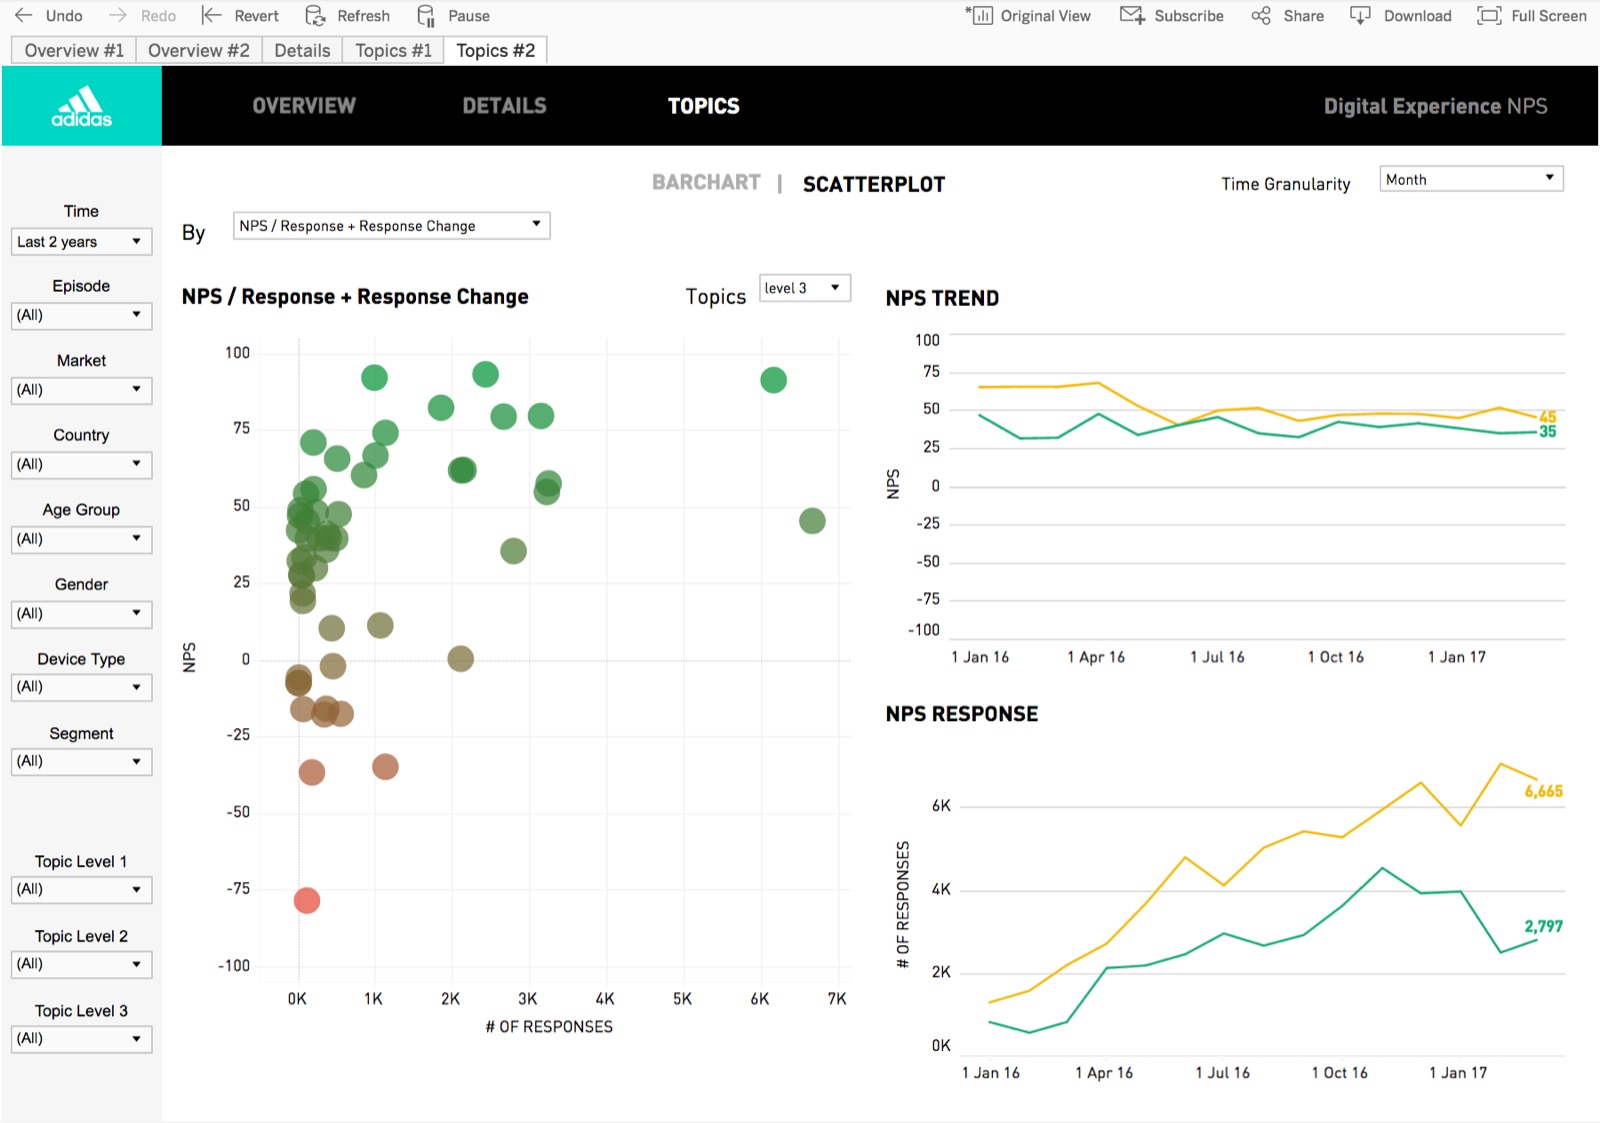
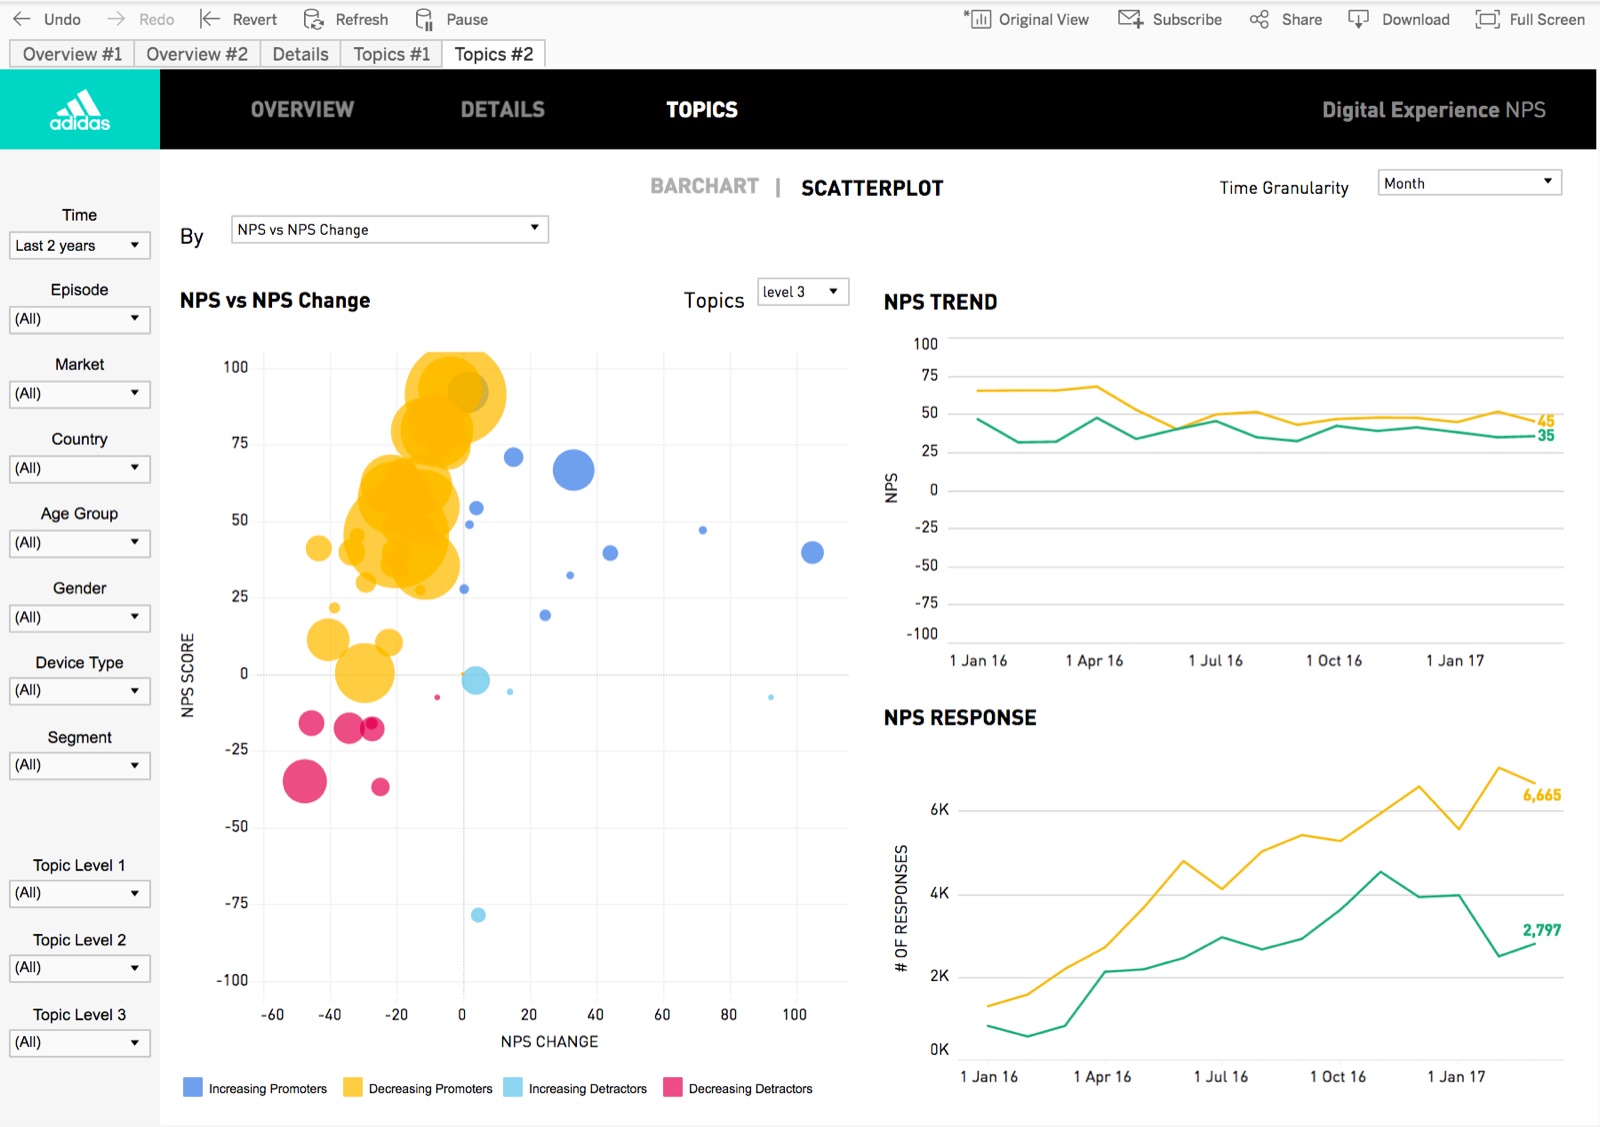
- Topics: find what was negatively impacting the market — and which chart worked best
- Comments: give feedback on two proposals for adding comments to the dashboard
Four ways to show topics
Results
| Rated by all testers | Score | Scale |
|---|---|---|
| Topics — bar chart | 5/5 | clarity / usefulness |
| Comments feature | 4/5 | clarity / usefulness |
| Filtering | 4/5 | clarity / usefulness |
| Overview task | 2/5 | difficulty (1 = very easy) |
| Topics task | 2/5 | difficulty (1 = very easy) |
| Details task | 3/5 | difficulty (1 = very easy) |
| Speed | 4/5 | 1 = slow, 5 = fast |
| Flexibility | 4/5 | 1 = low, 5 = high |
Best :)
Scatterplots and top topics; response speed, filters, details, segmenting & trending, compare graphs.
Worst :(
Time / date handling and explanations; no keyword search, legends.
Strengths
Spotting pain points and deep dives; comparison with events — fewer ad-hoc solutions to build.
# Final design
# Next steps
The approach scaled beyond NPS: more dashboards for the digital analytics team, and a shared set of guidelines and a design system to harmonise them — see Dashboard styleguides.