Case studies / 05
Dashboard styleguides: design & practices
- Client
- adidas — Digital Analytics
- Scope
- Principles, data handling, page types, components, charts, colours
- Tools
- Zeplin · InVision · Tableau
# Why
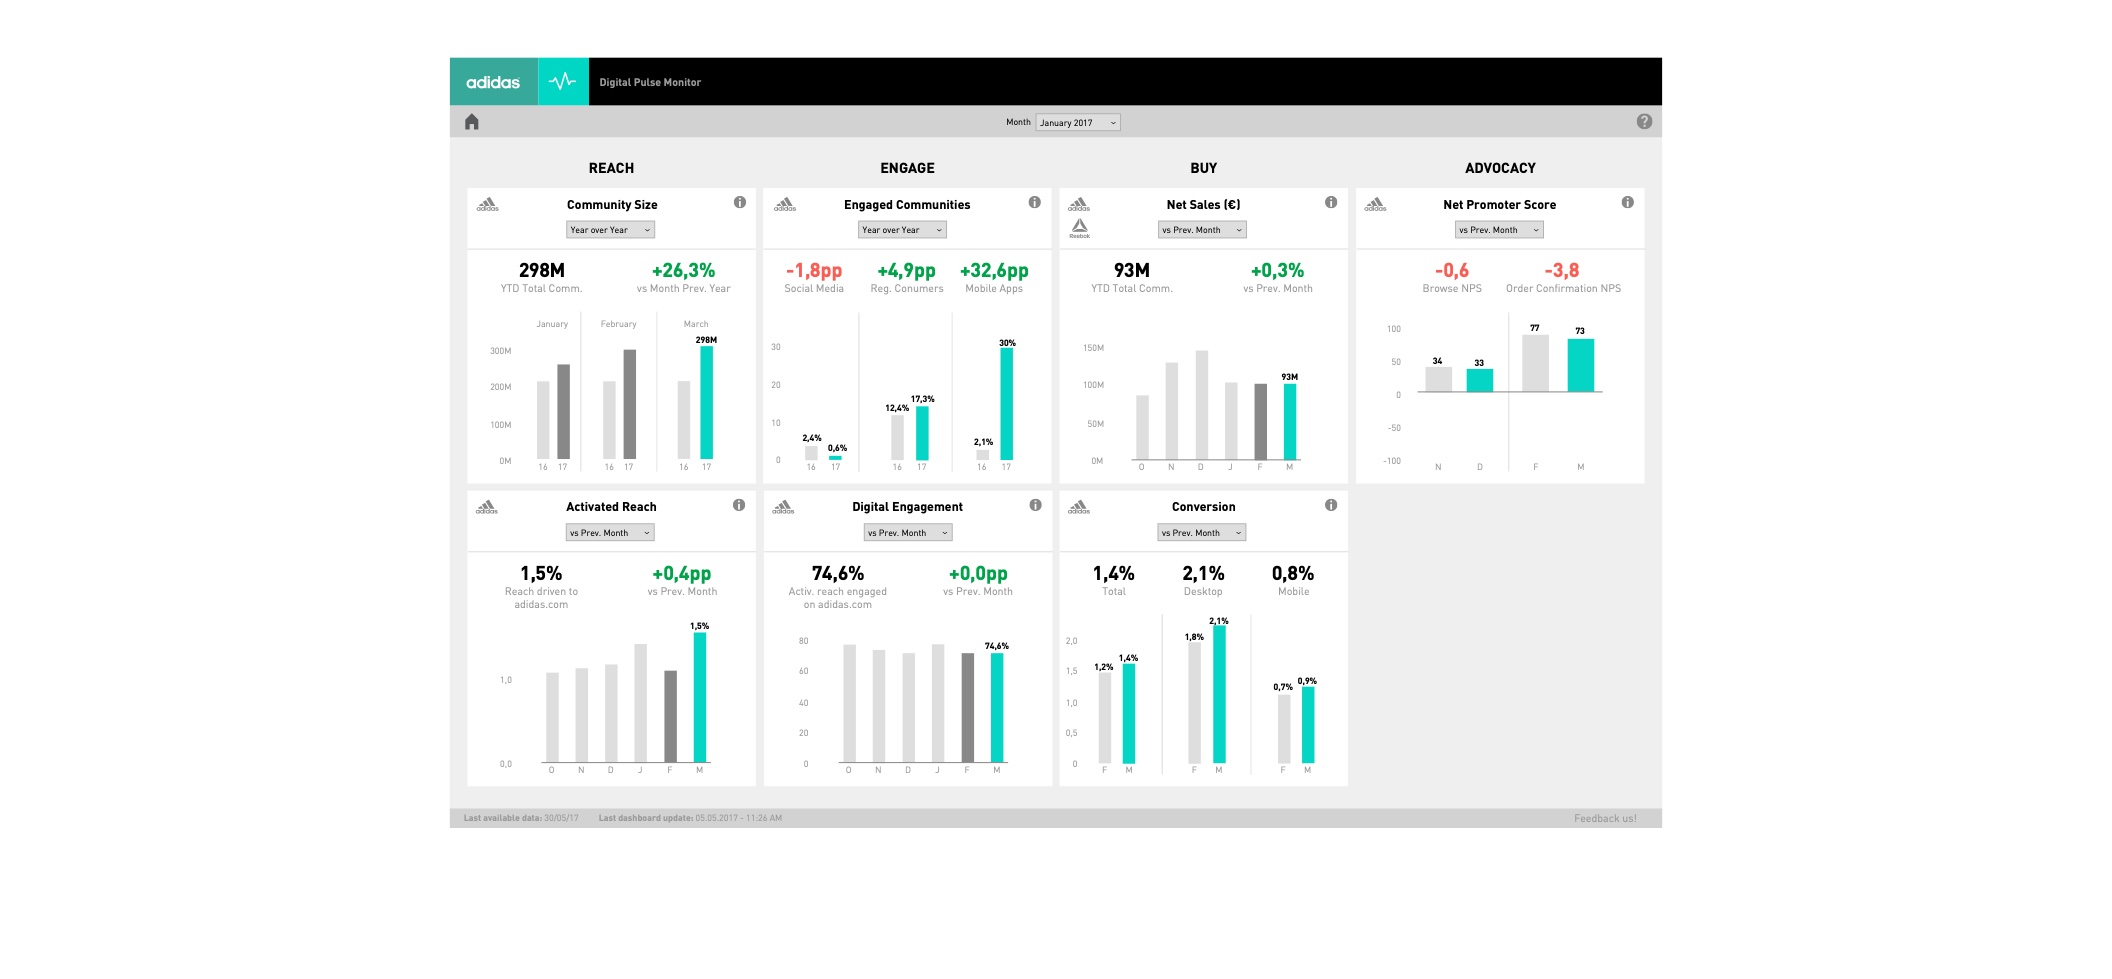
After the NPS dashboard, more and more dashboards were being built by different teams — each with its own layout, colours and way of filtering.
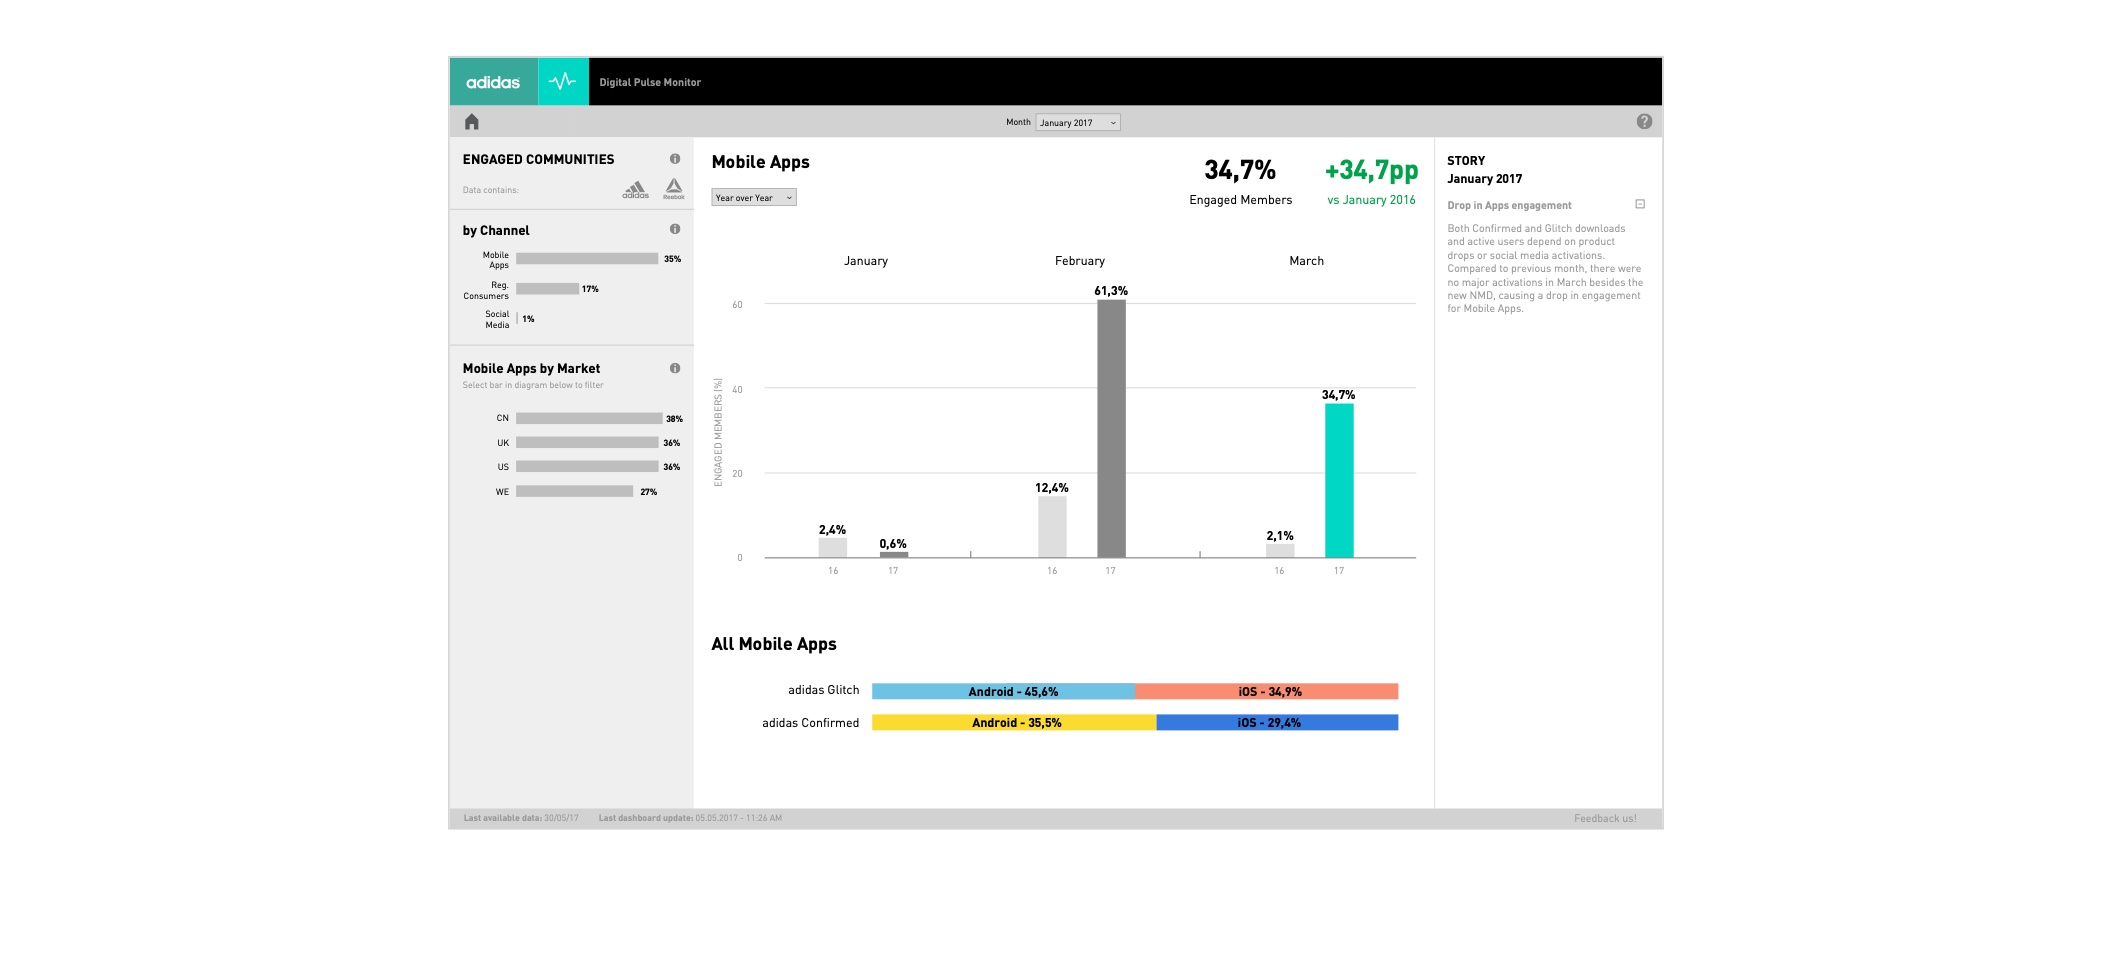
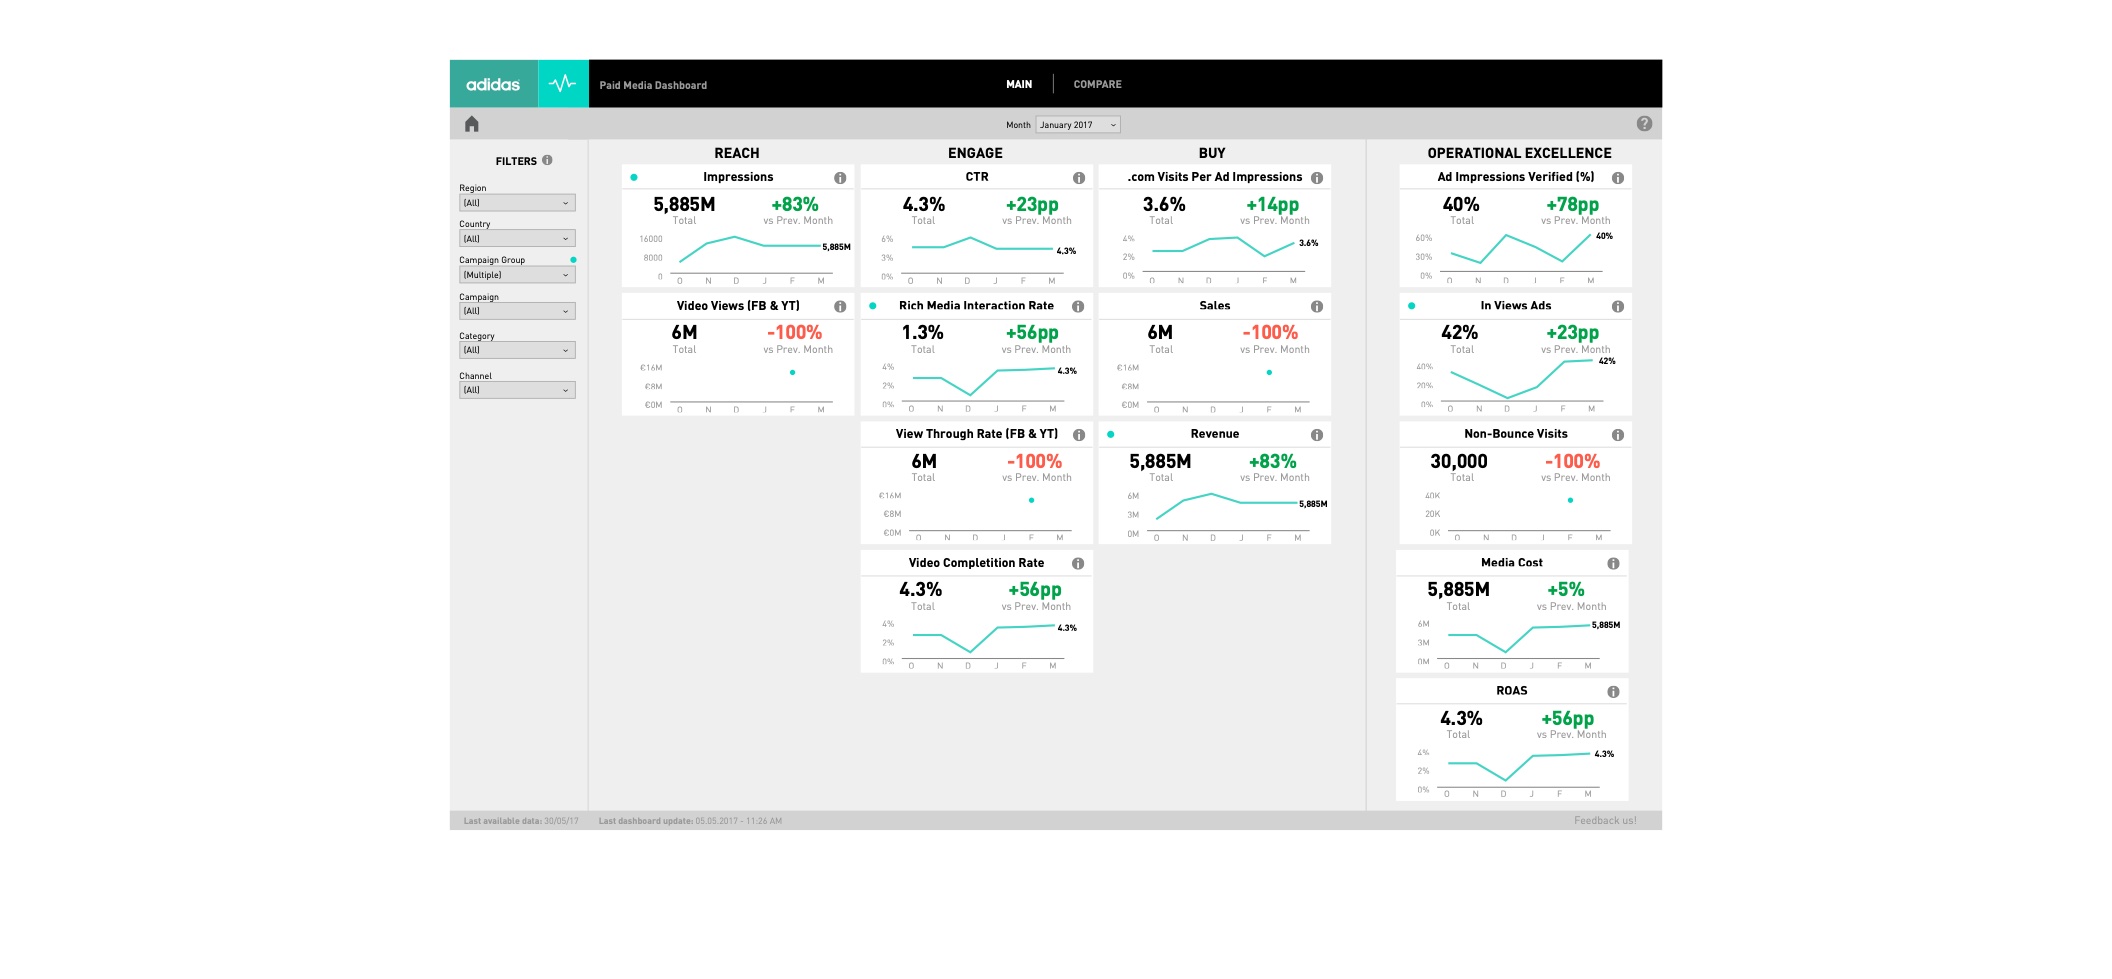
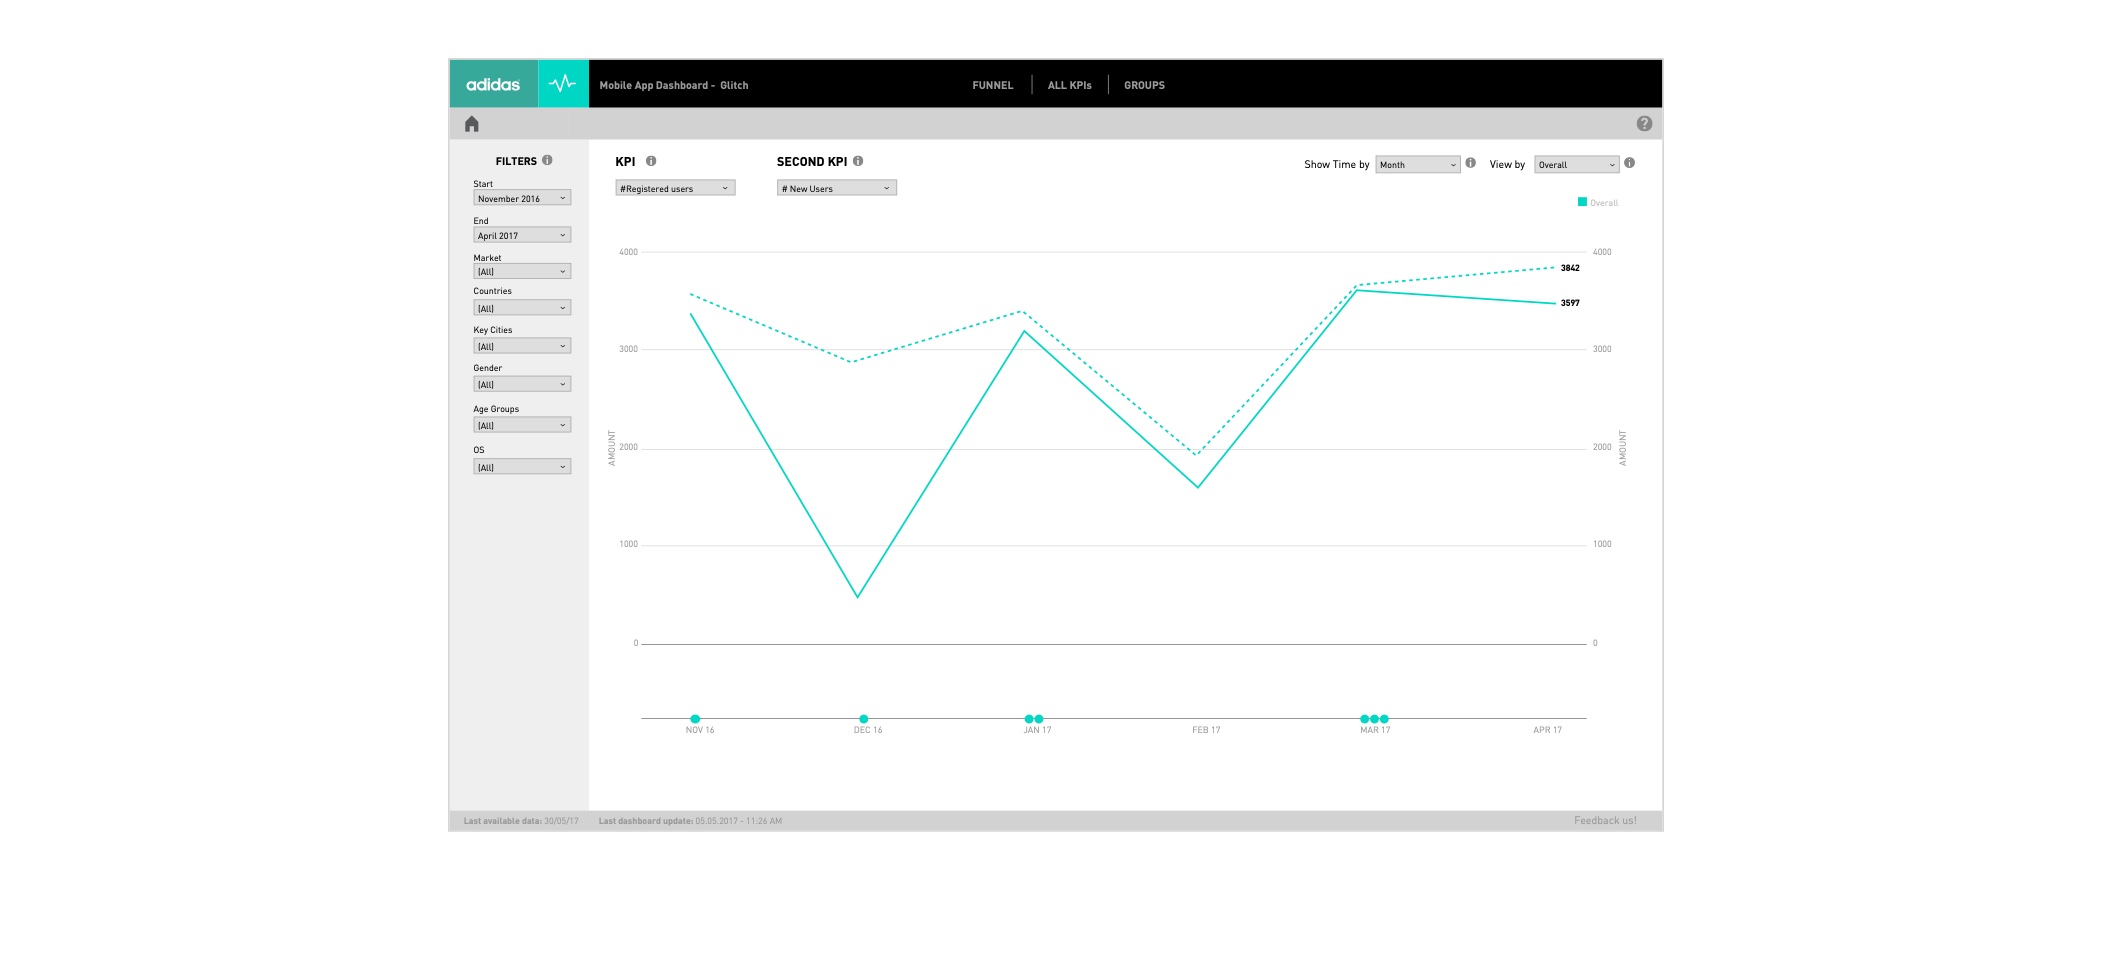
The styleguide harmonised them: a living document with guiding principles, best practices for handling and filtering data, page templates, a component library, chart templates and colour palettes, so any team could build a dashboard that looks and works like the others.
01Simplify
Show only what is needed; simplify numbers and views as much as possible.
02Flat
A flat, clean visual language that puts the data first.
03Intent
Every page, tile and chart serves a clear user intent.
# Data handling
| Rule | Example | Note |
|---|---|---|
| Decimals only when needed | 32.83475 → 33 | Some KPIs need decimals: 32.83475 → 32.8 |
| Simplify big numbers with units | 12,345,354 → 12M | 21,120 → 21K |
| Units: millions, thousands, %, revenue | 32.8M · 32.8K · 32.8% · 32.8€ | Same font size, no blank space |
# Filtering
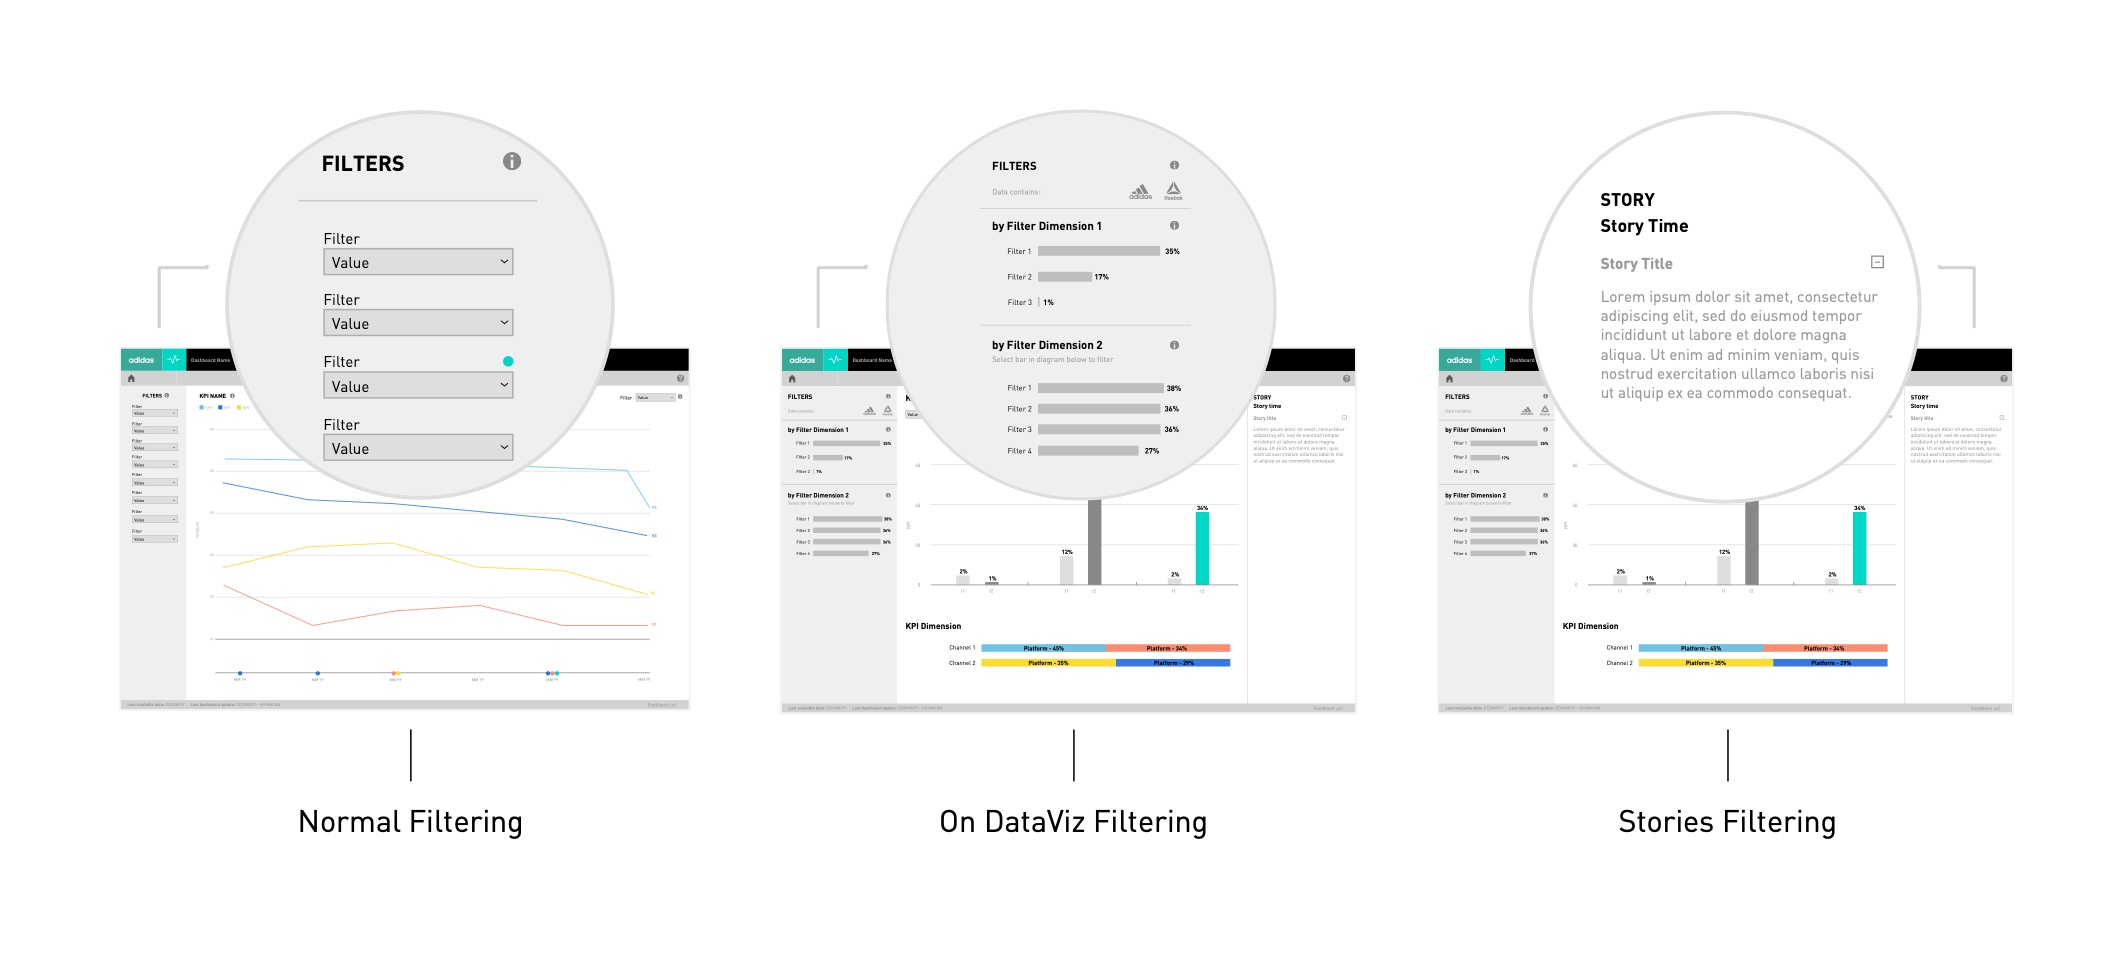
Filtering
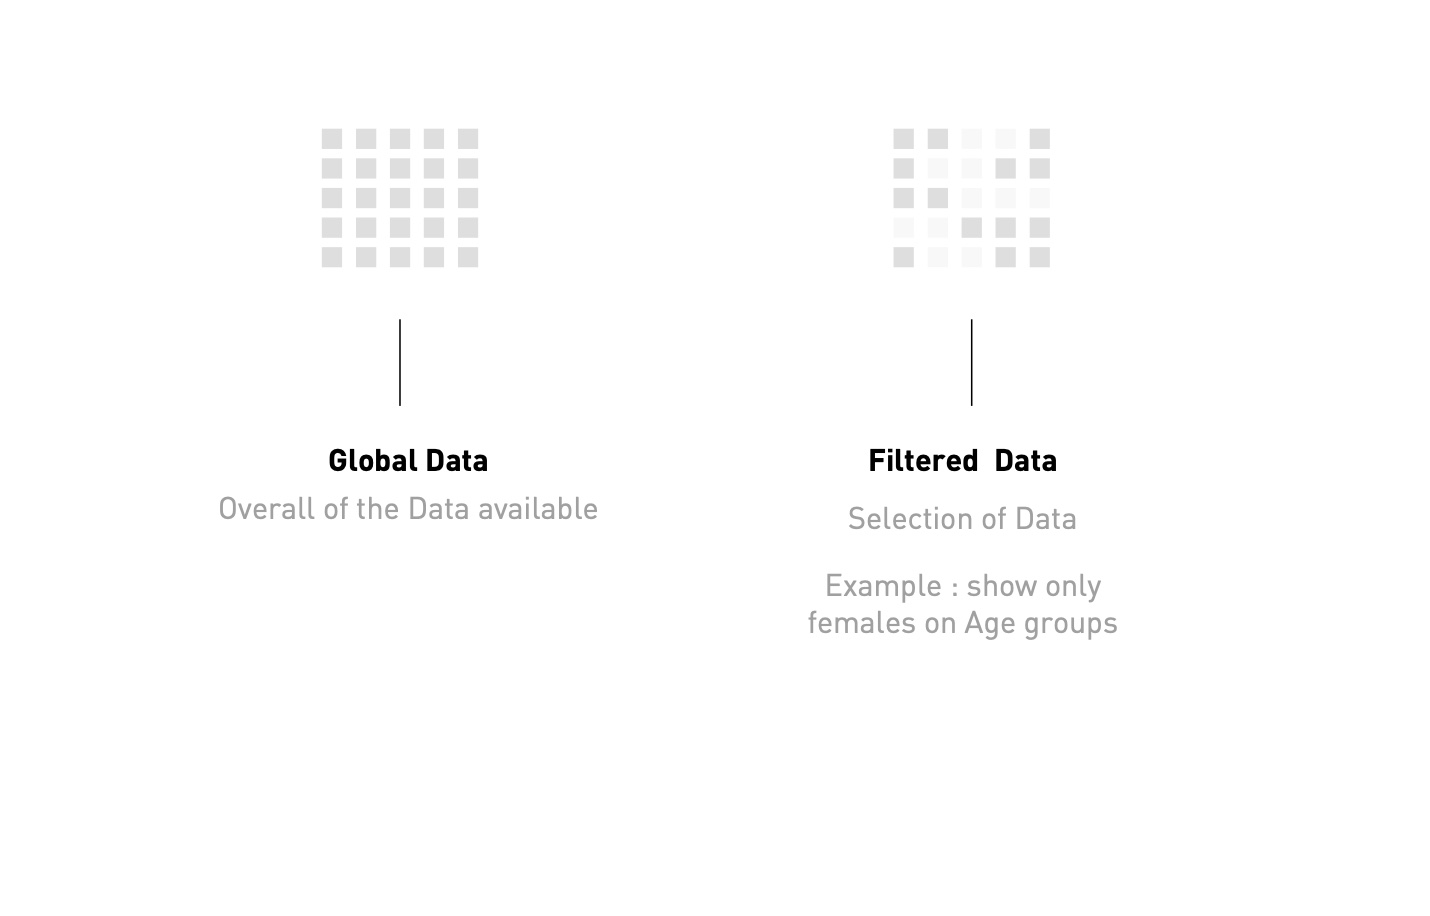
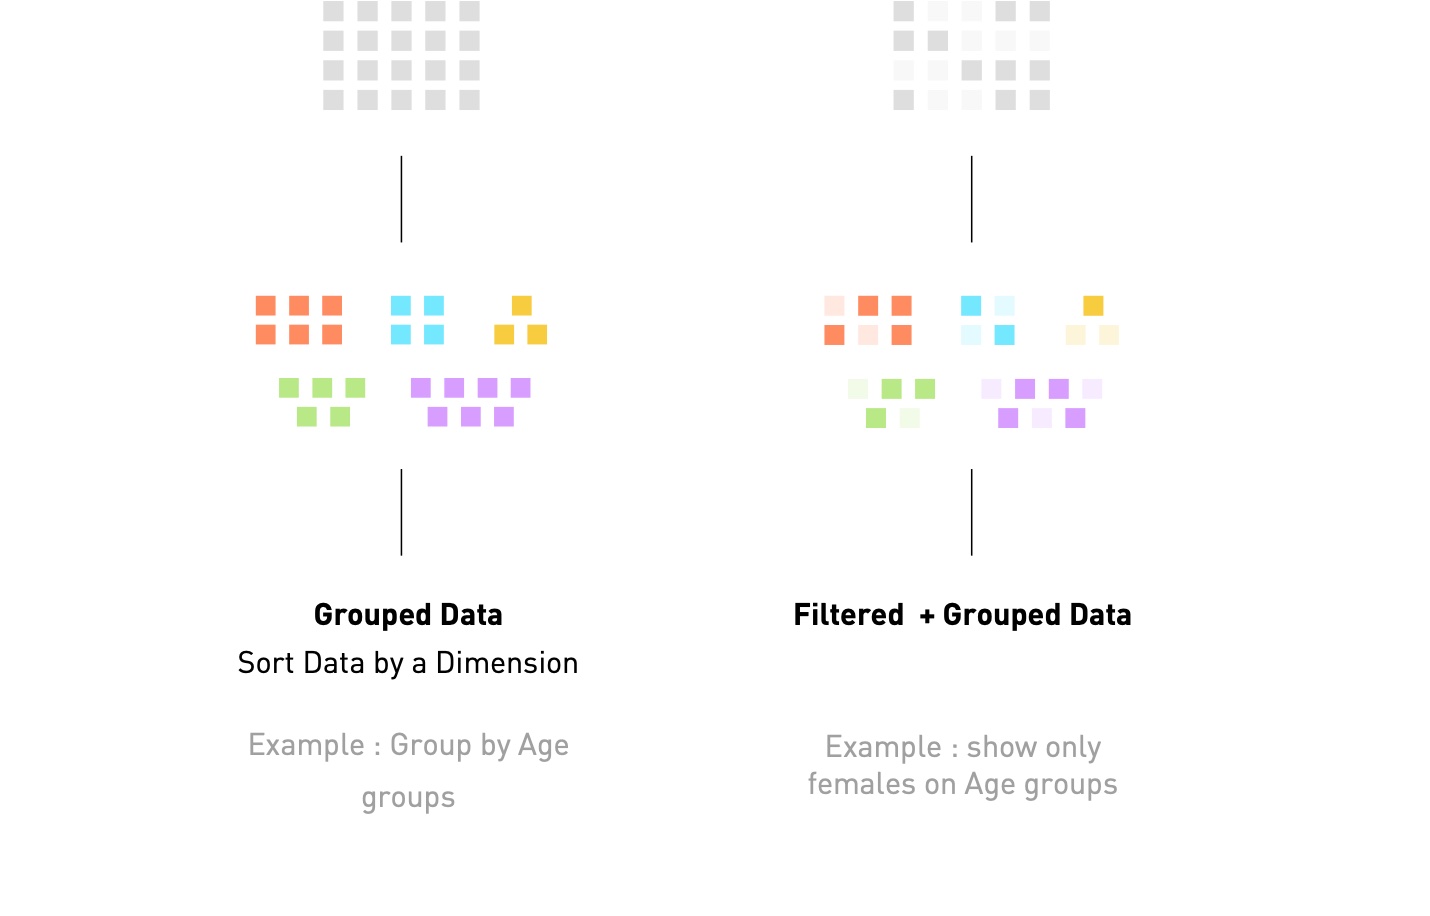
A selection of the available data, to focus on specific groups or segments — only the amount of data changes.
Grouping
Arranges the selection by a dimension of the data, creating groups. Filtering then restricts the result even more.
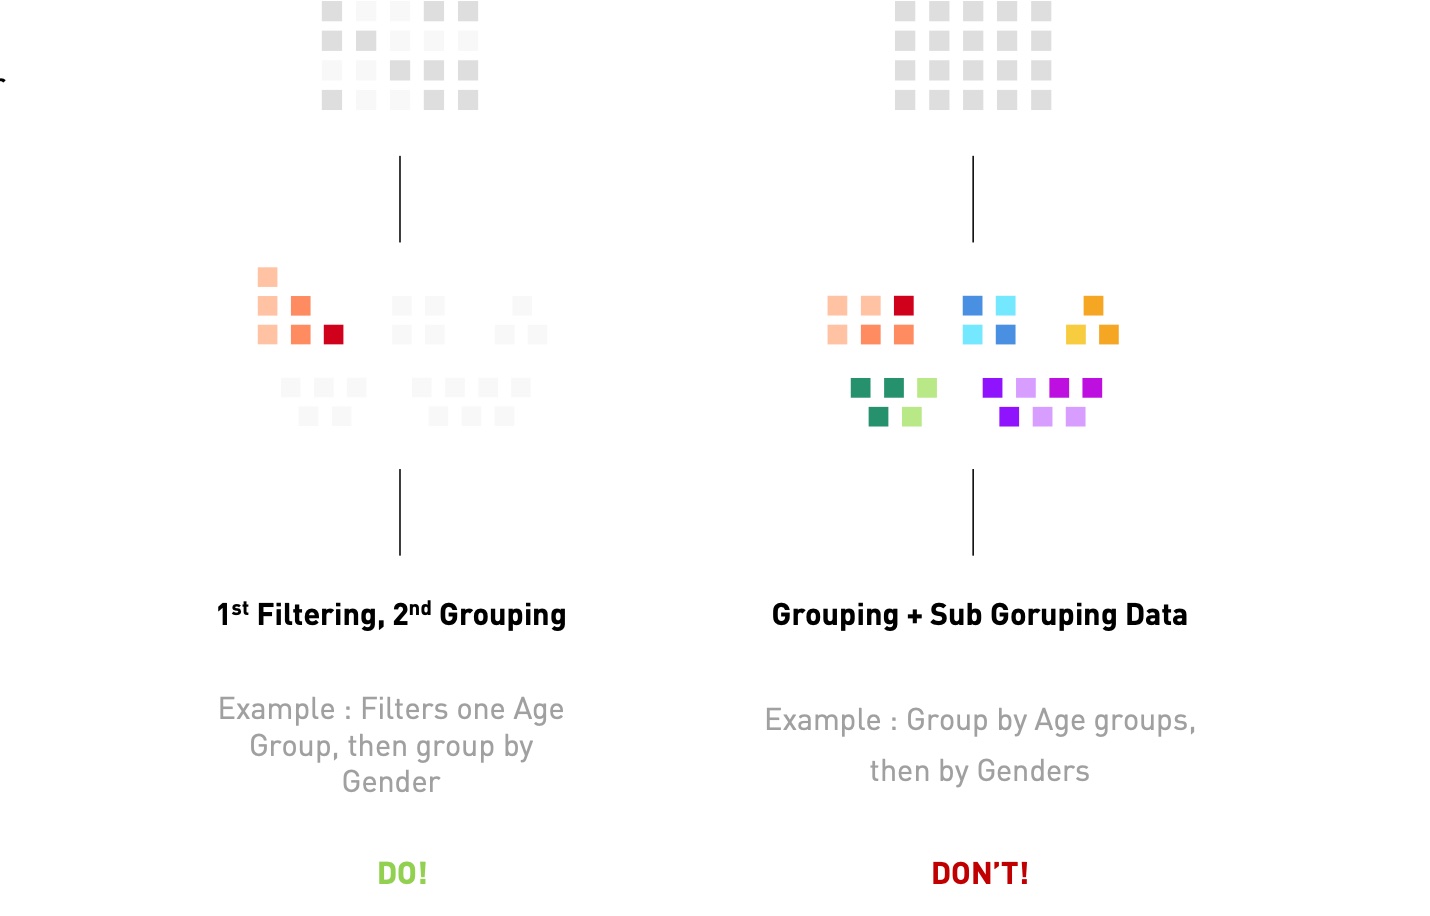
Do / don’t
Always filter first, then group. Double grouping creates too much visual complexity and no clear connection between the dimensions.
# Basic structure
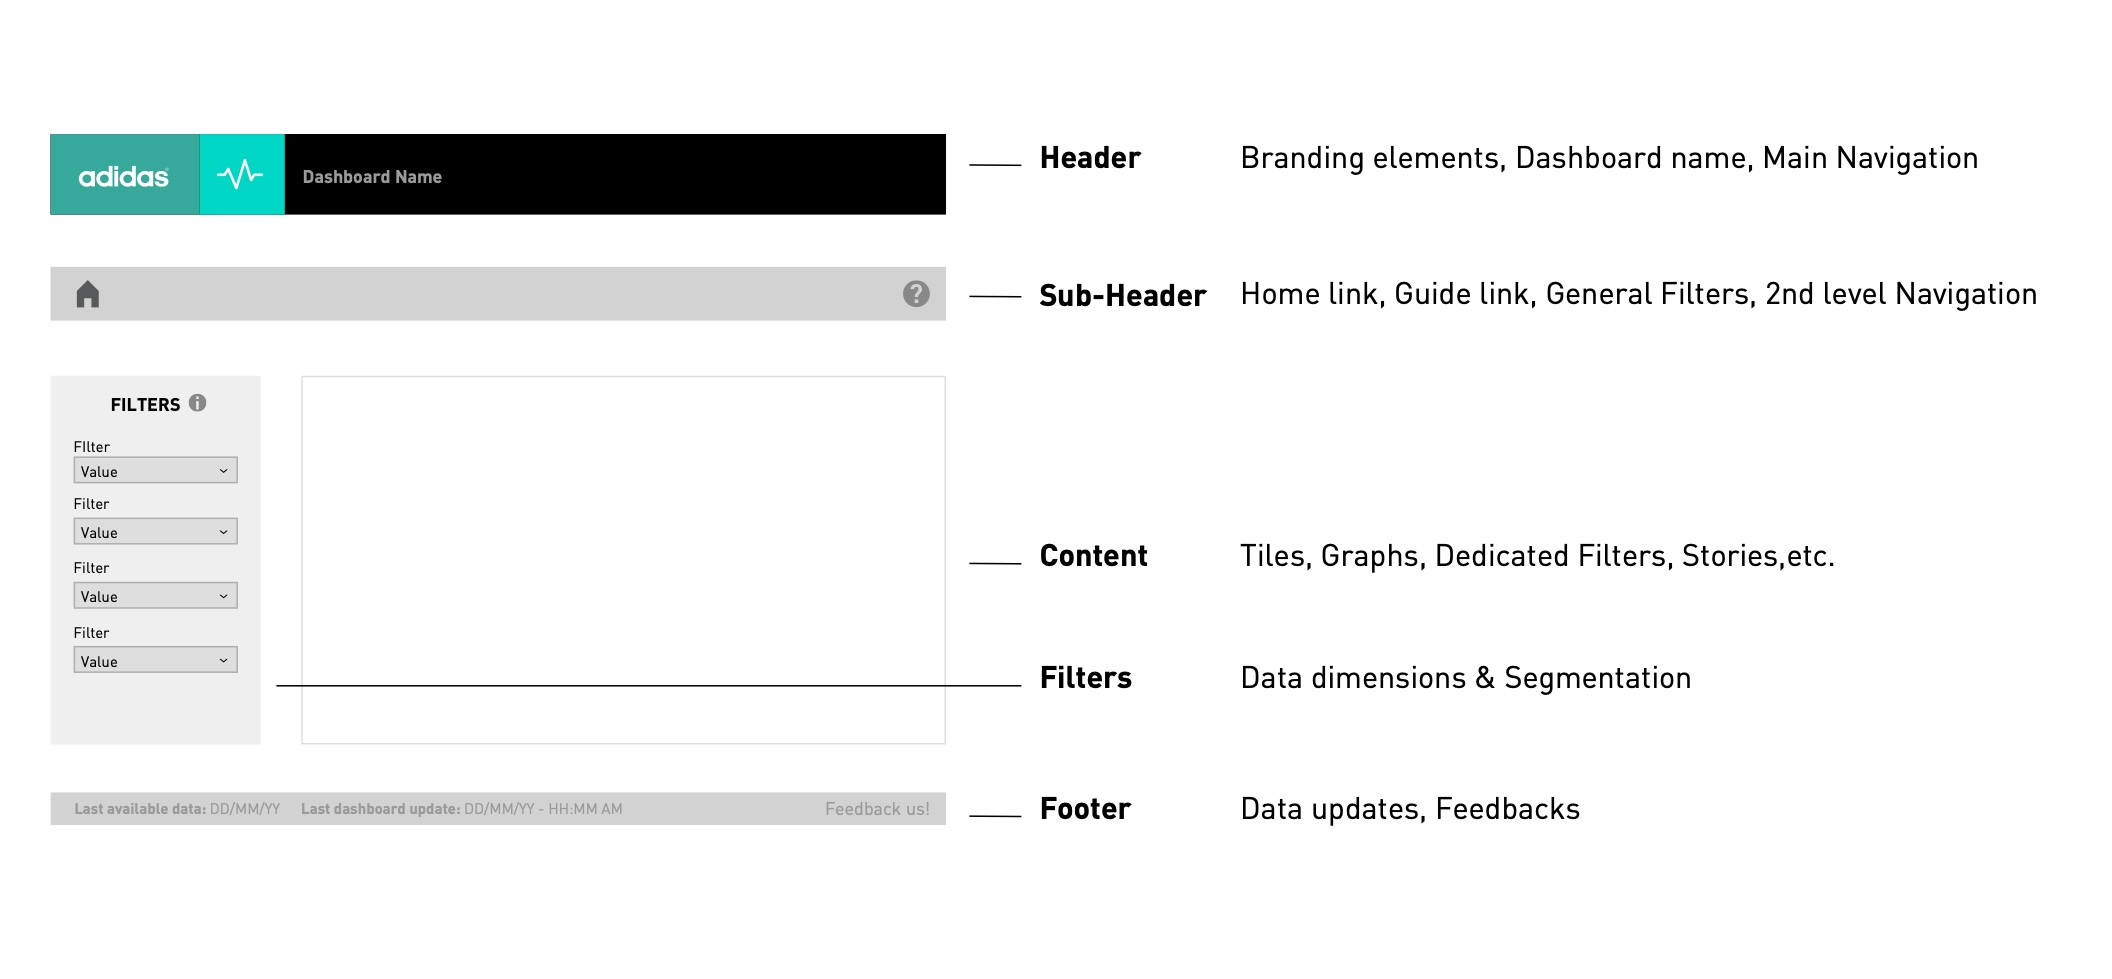
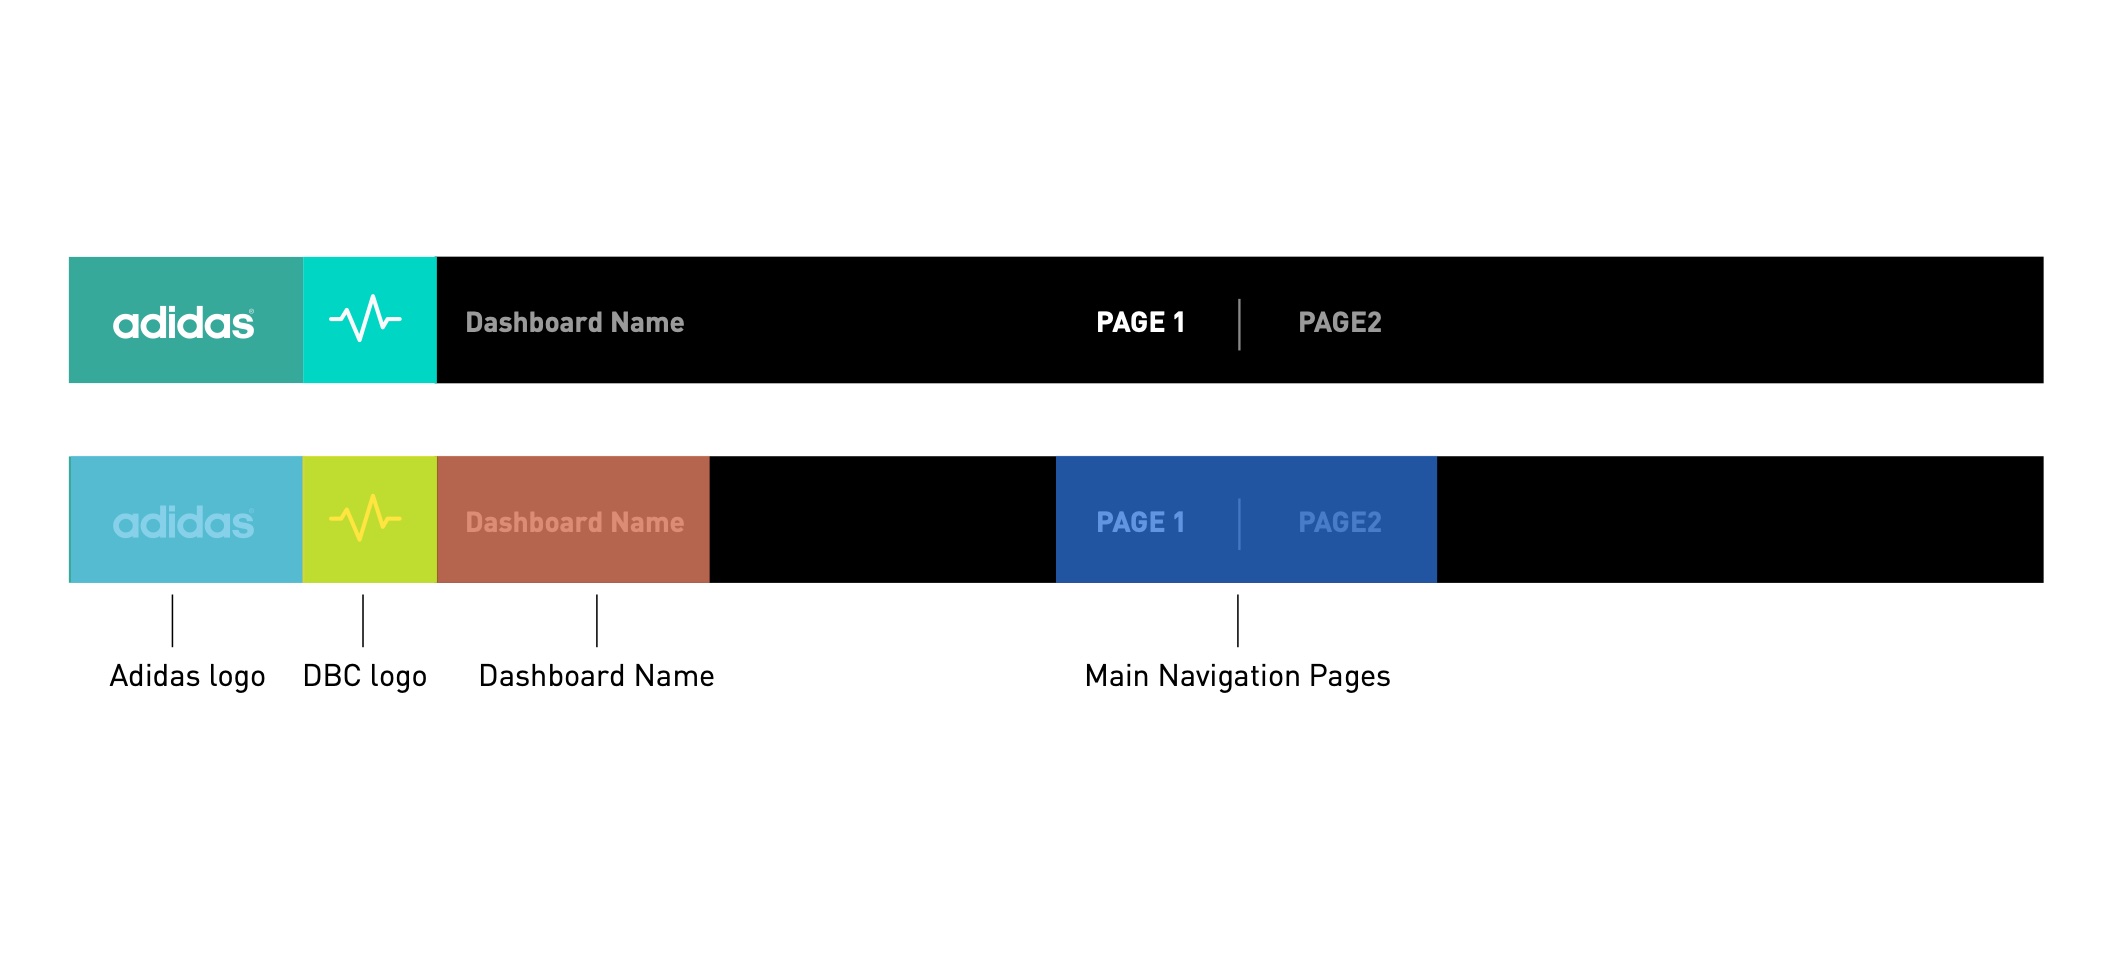
| Header | Branding, dashboard name, main navigation |
| Sub-header | Home and guide links, general filters, 2nd-level navigation |
| Content | Tiles, graphs, dedicated filters, stories |
| Filters | Data dimensions & segmentation |
| Footer | Data updates, feedback |
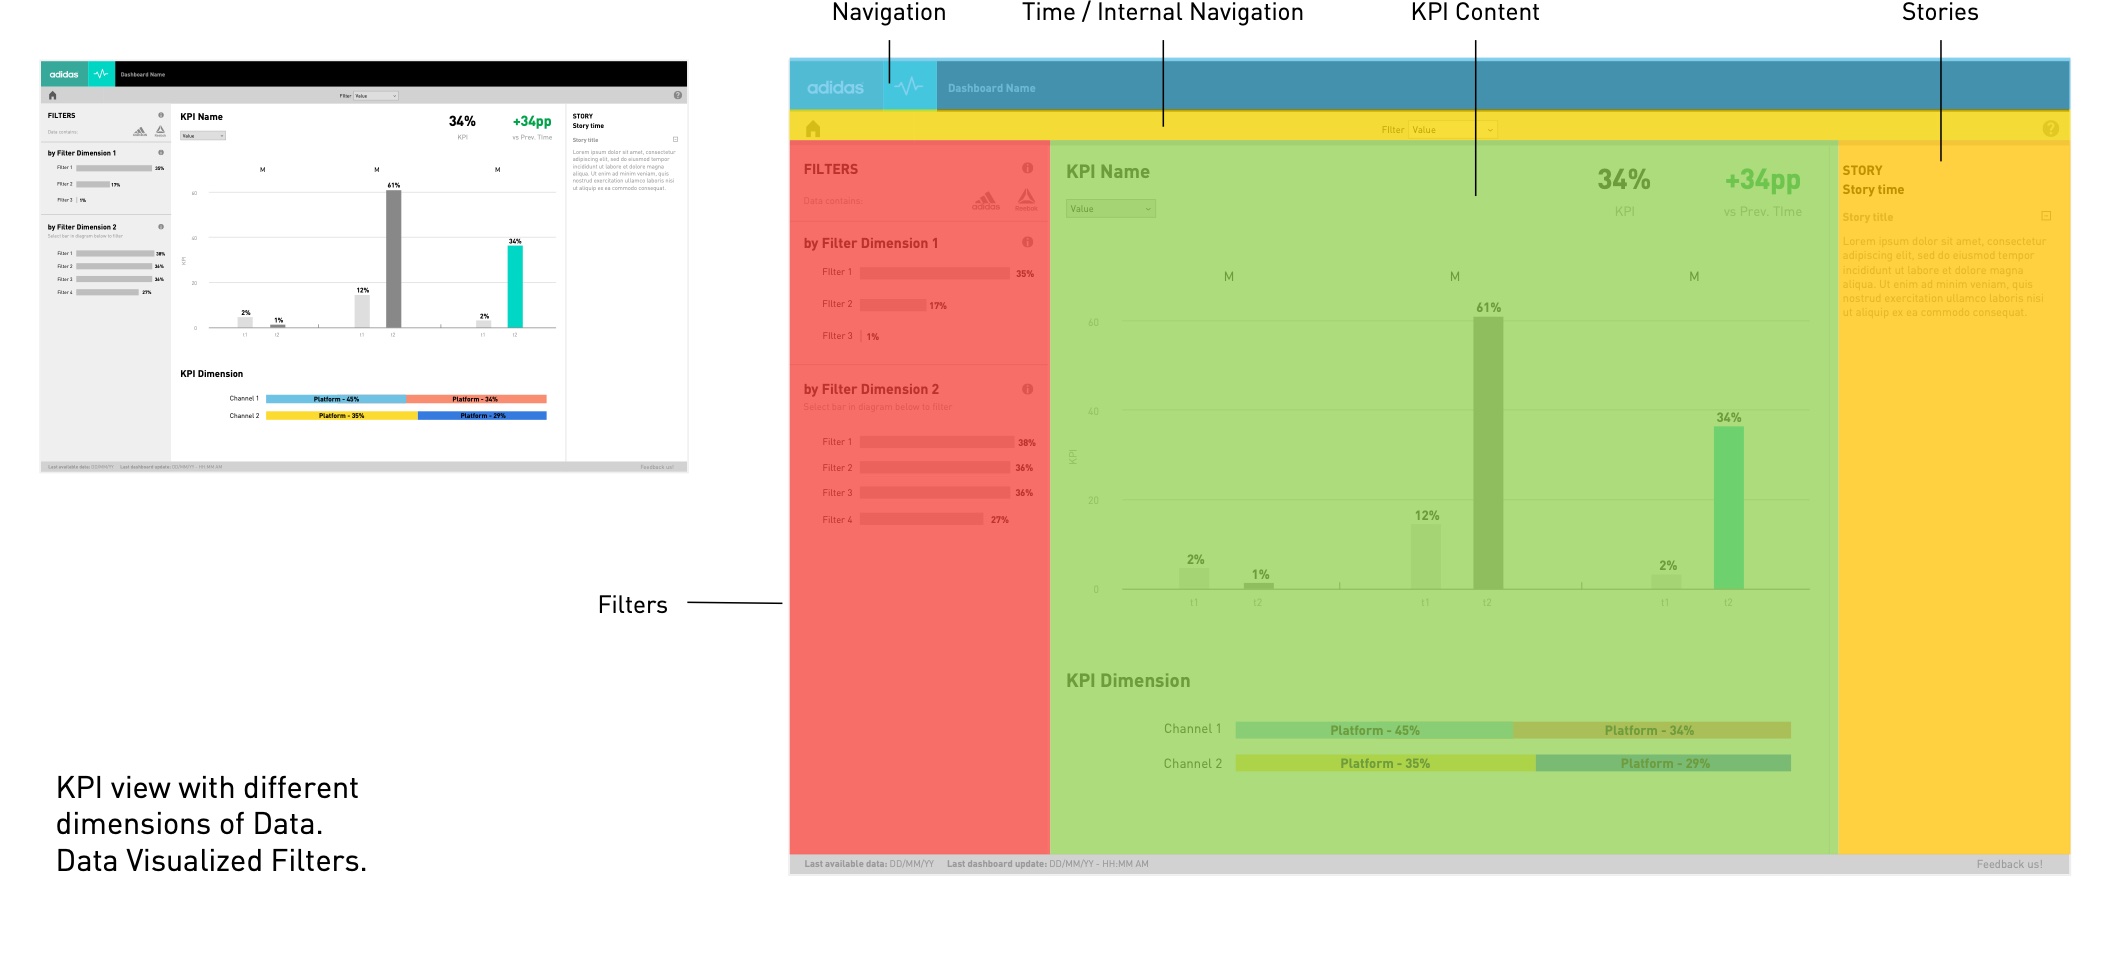
Three kinds of filtering: normal filtering in the side panel, filtering on details directly from a chart, and filtering through stories.
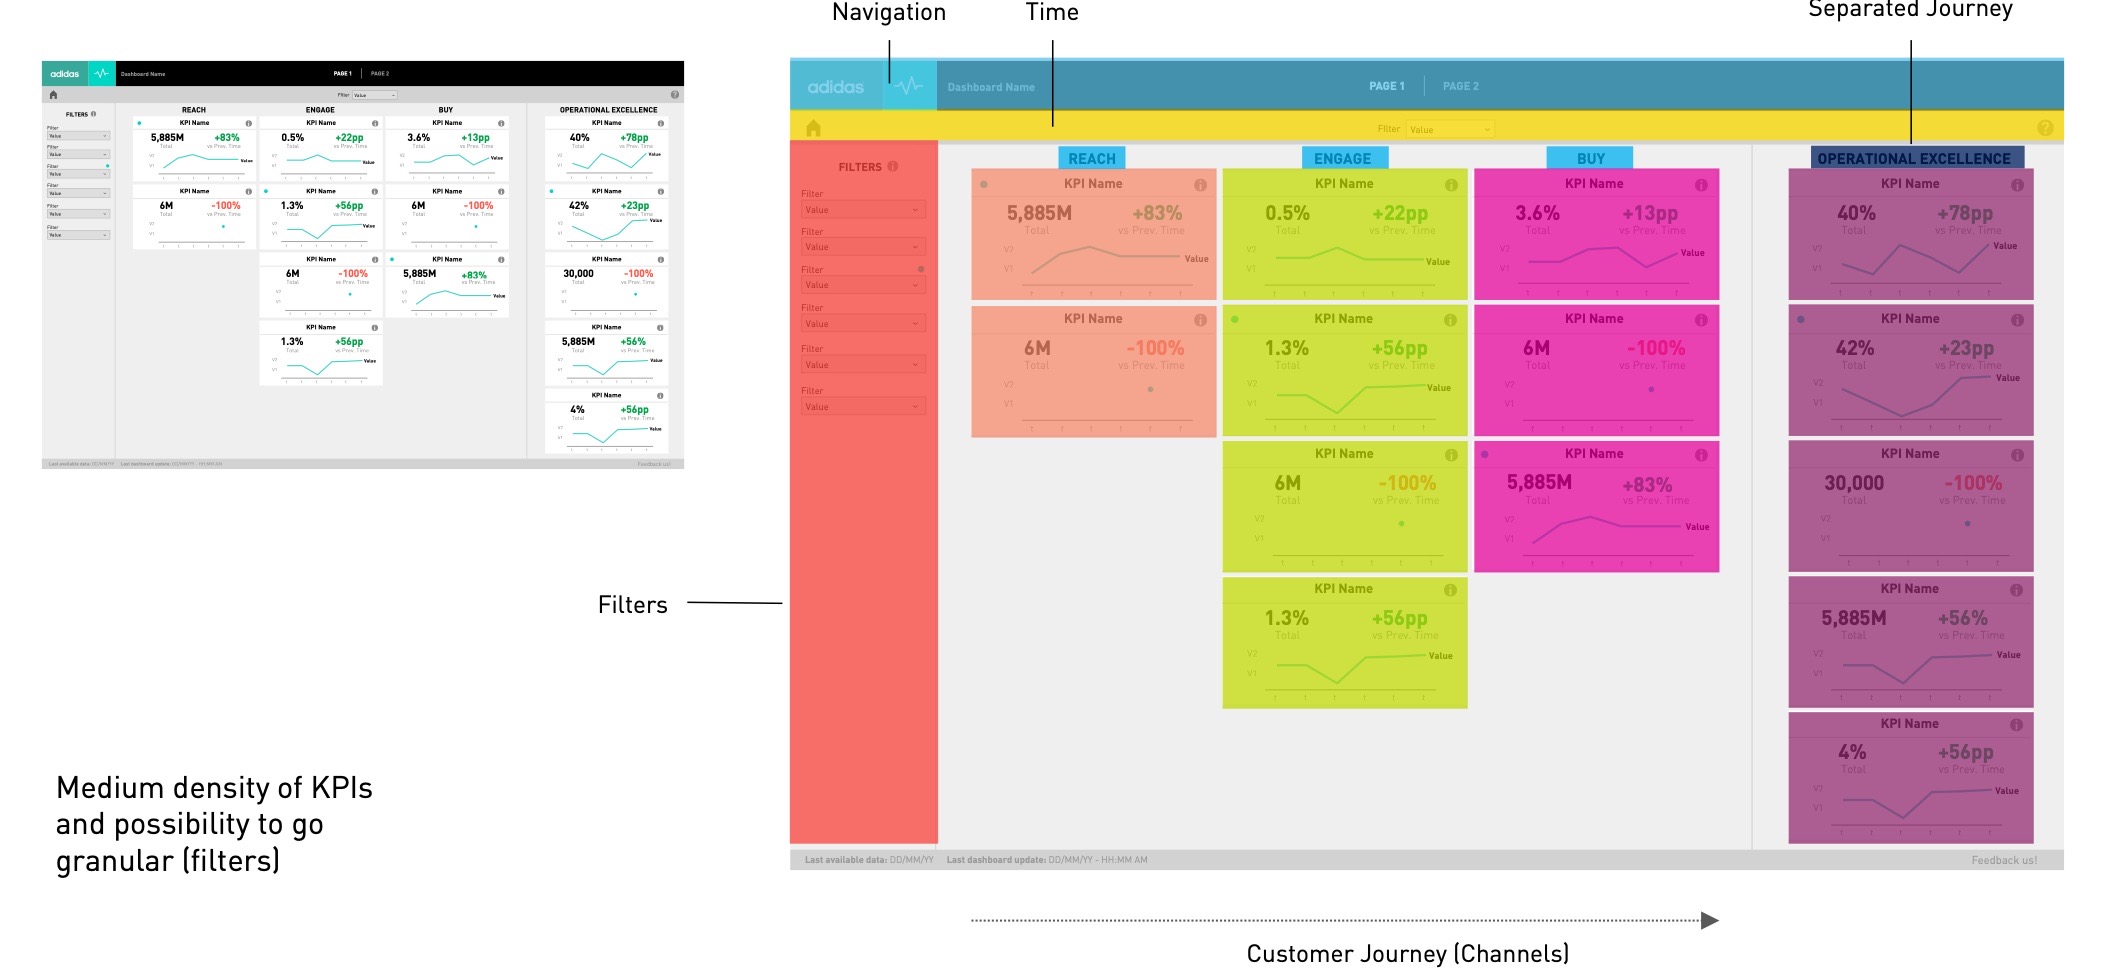
UI colours
# Page types
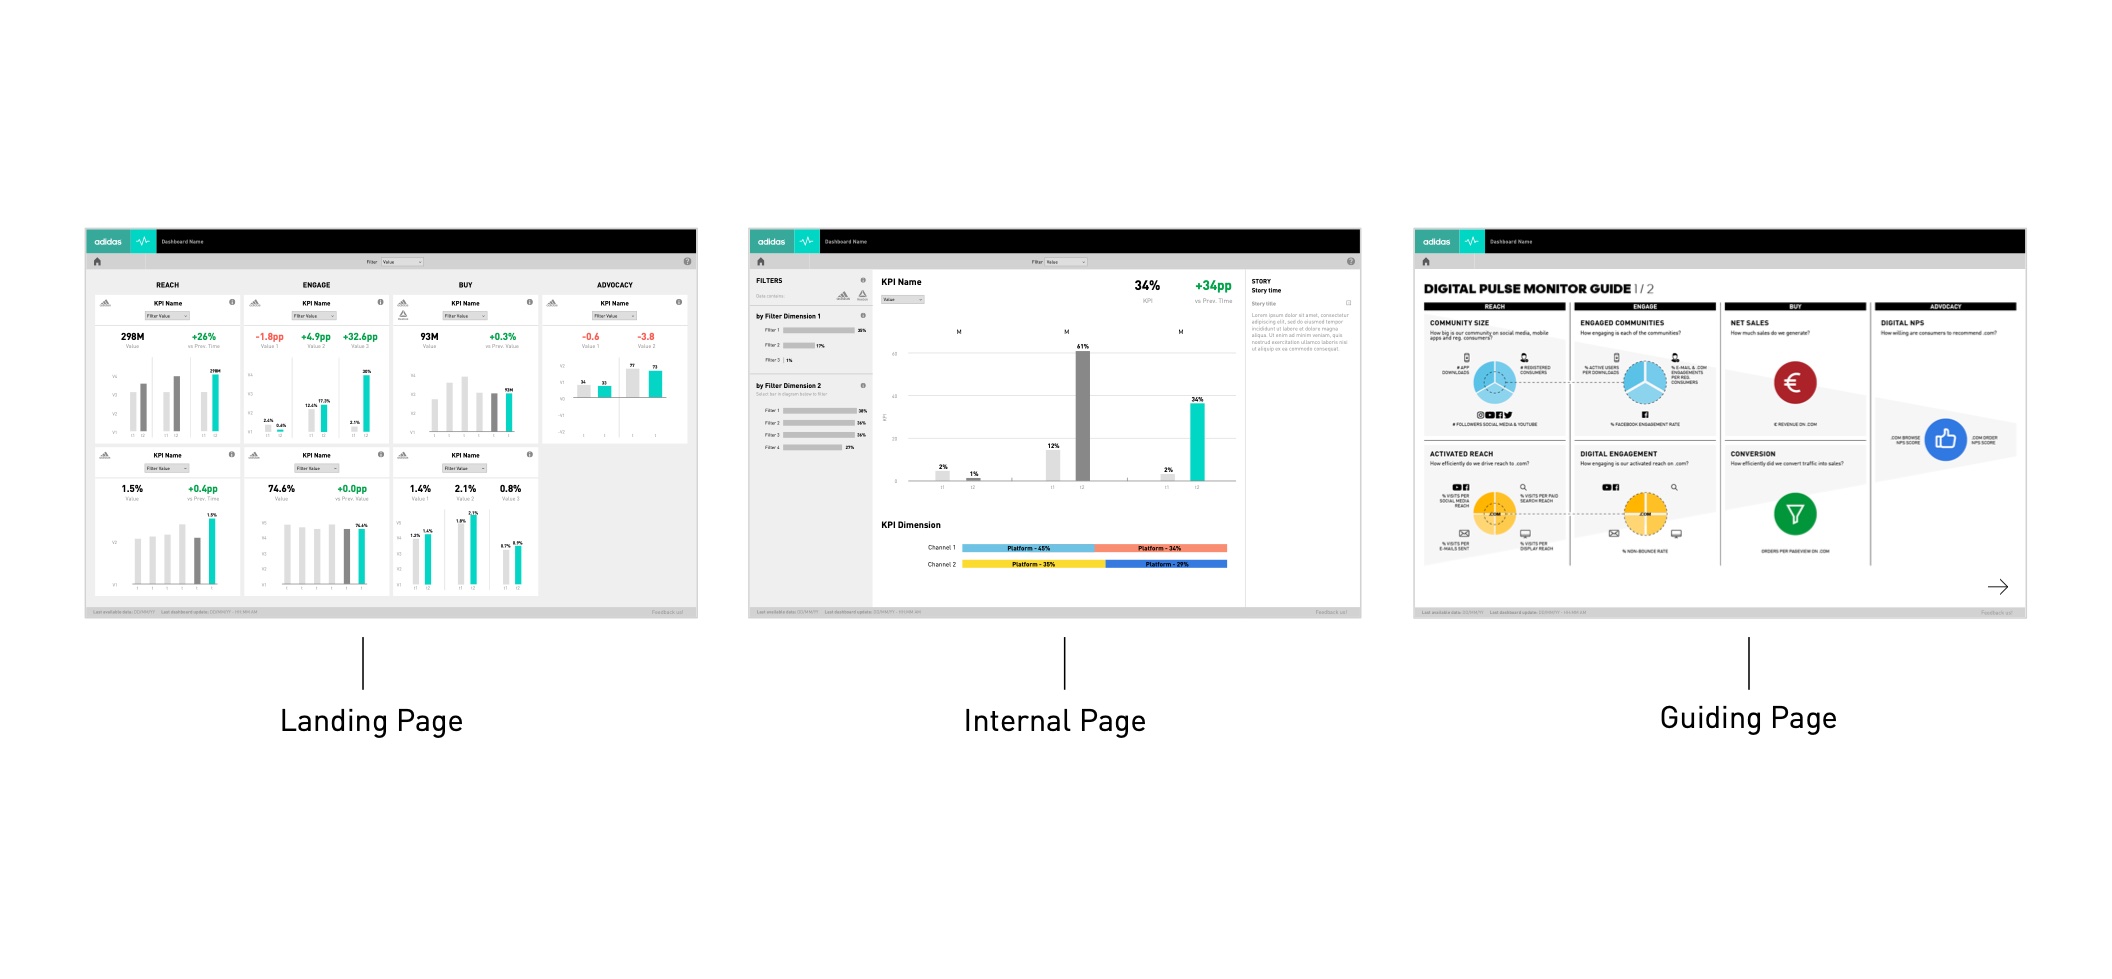
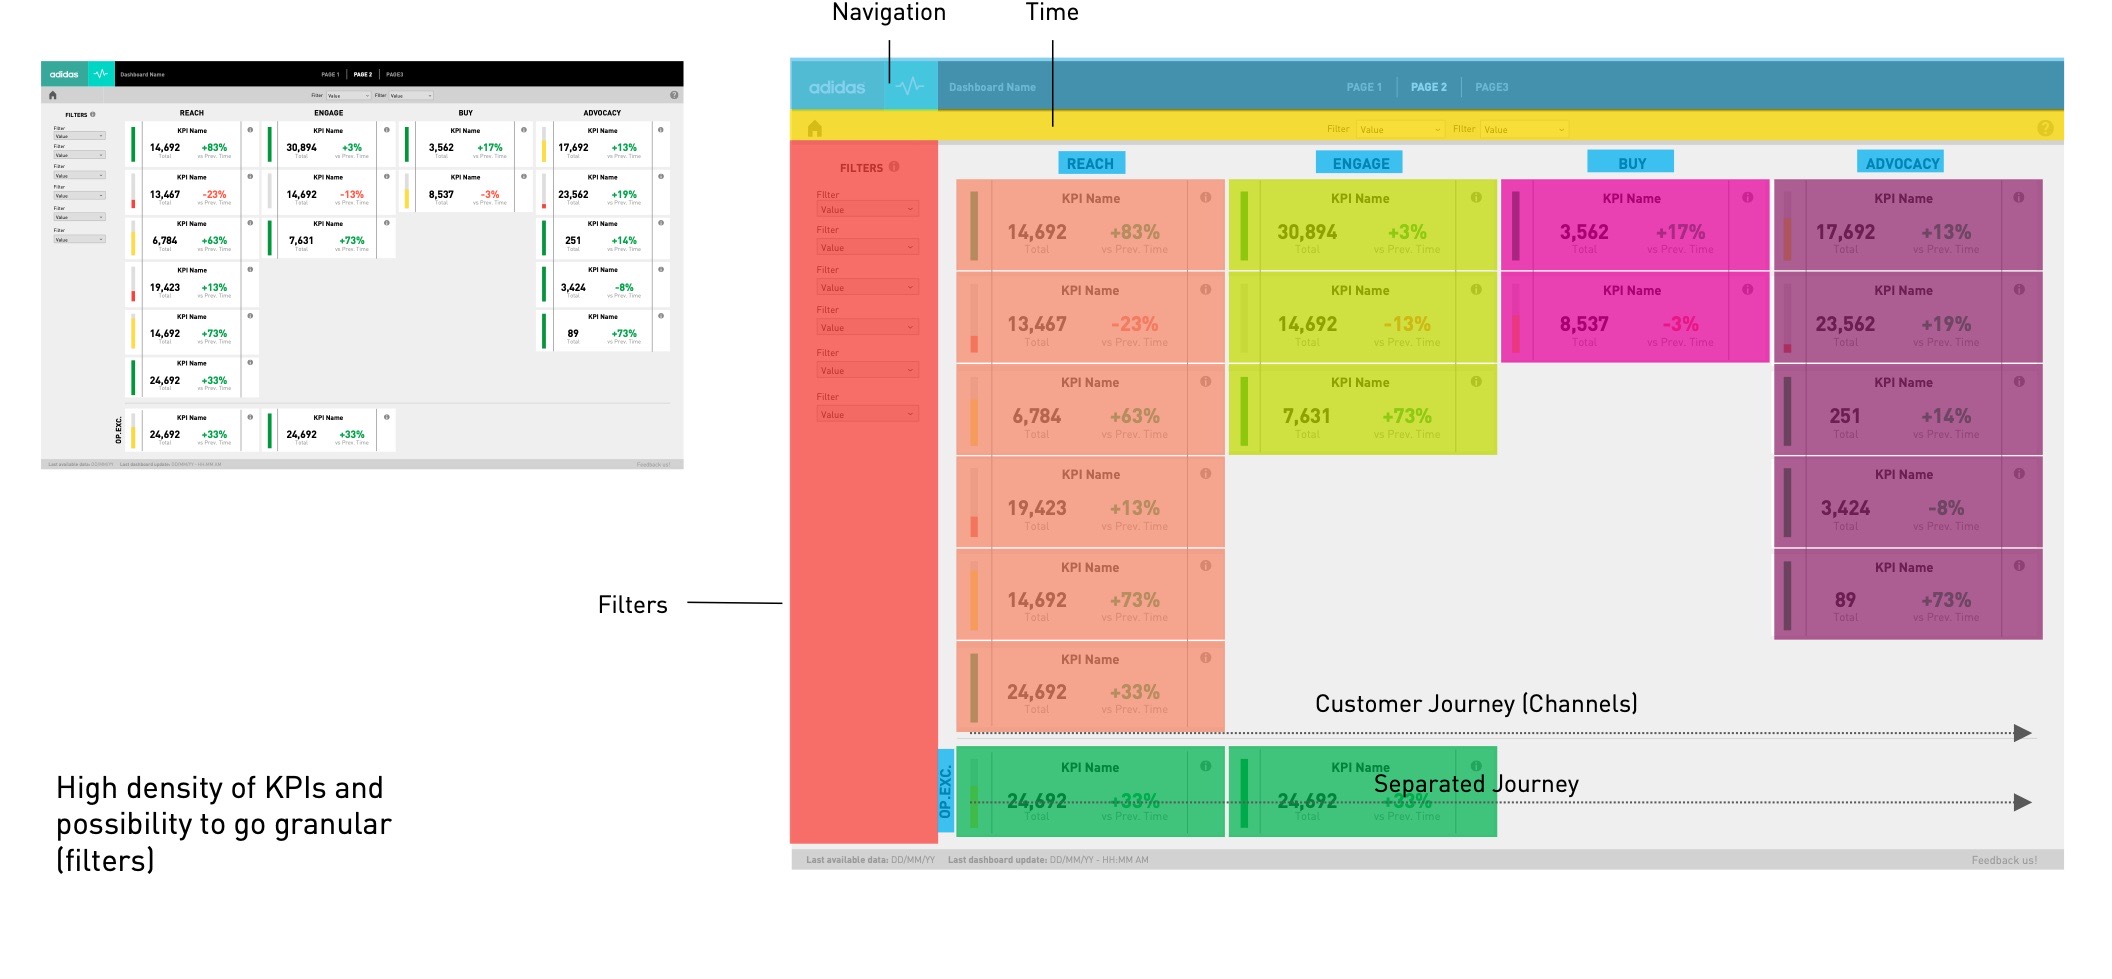
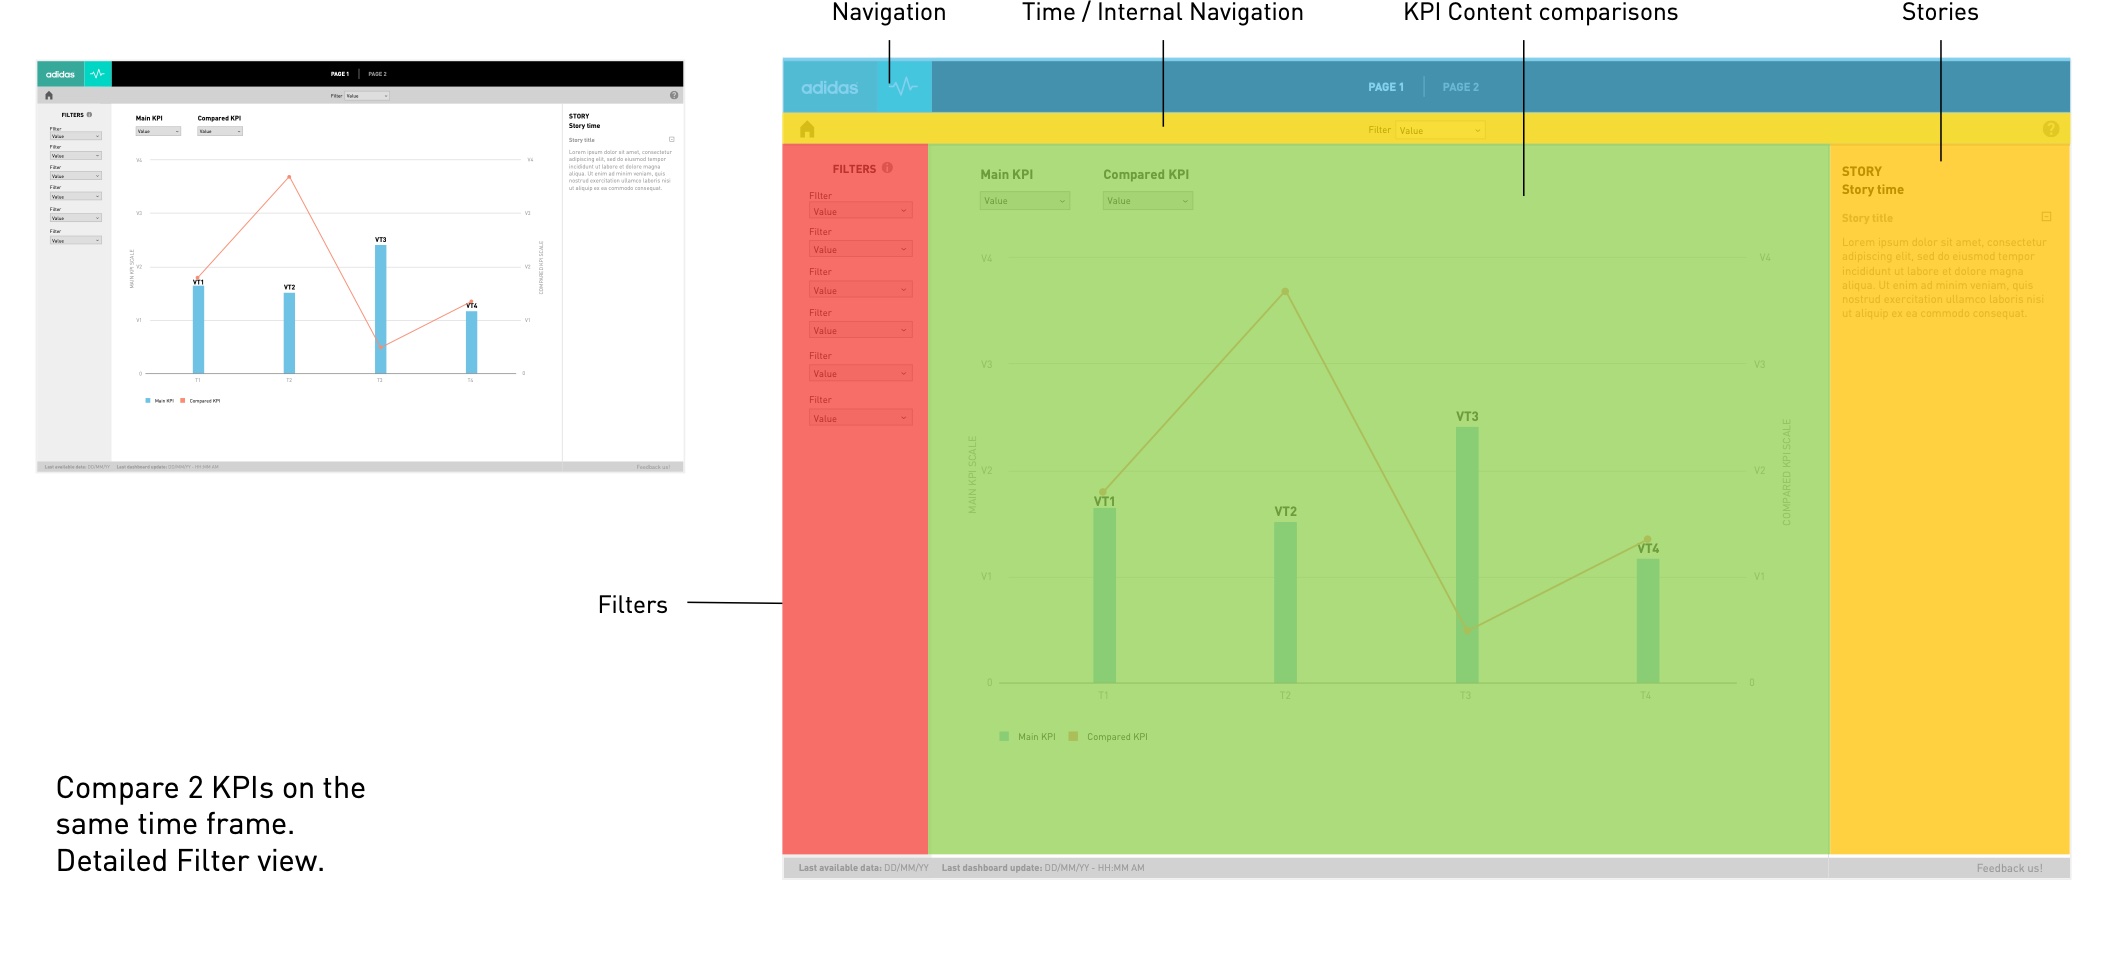
Three families — landing, internal and guiding pages — each designed for a level of detail and a type of user.


# Components
Tiles
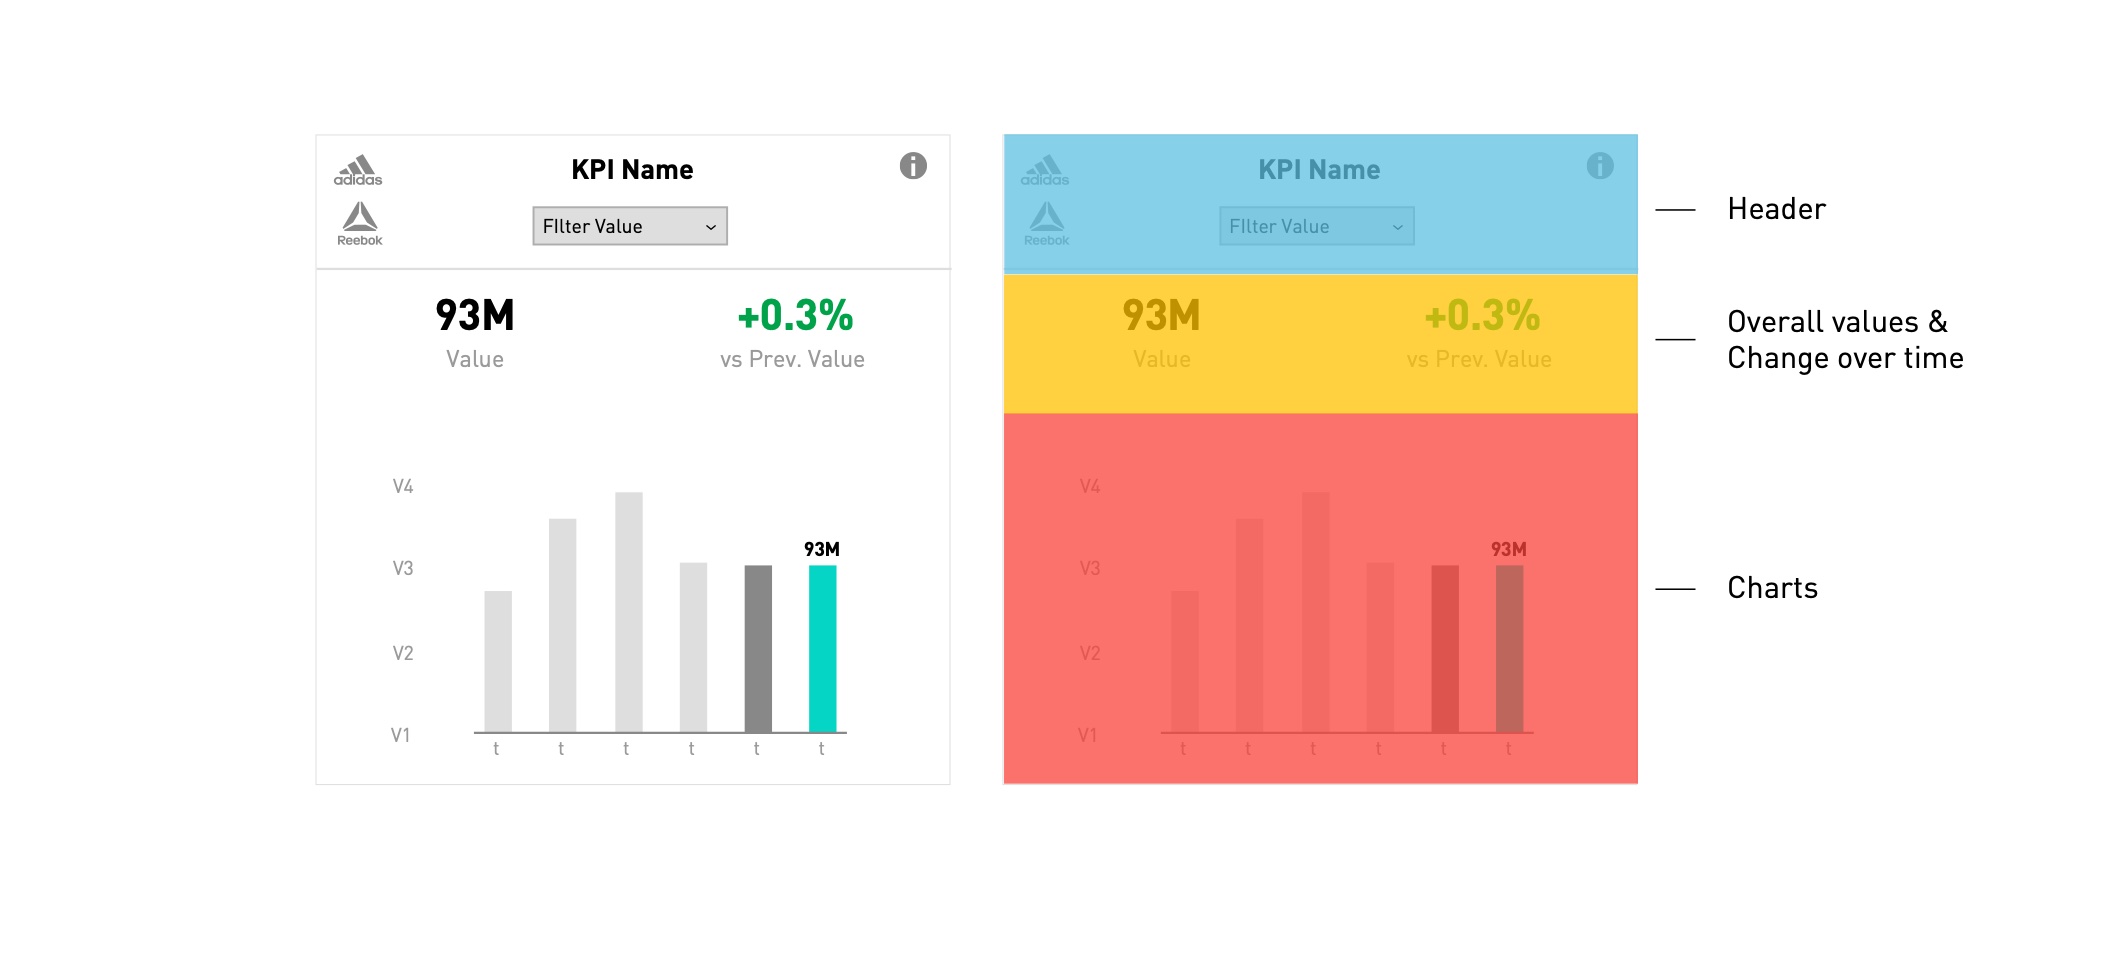
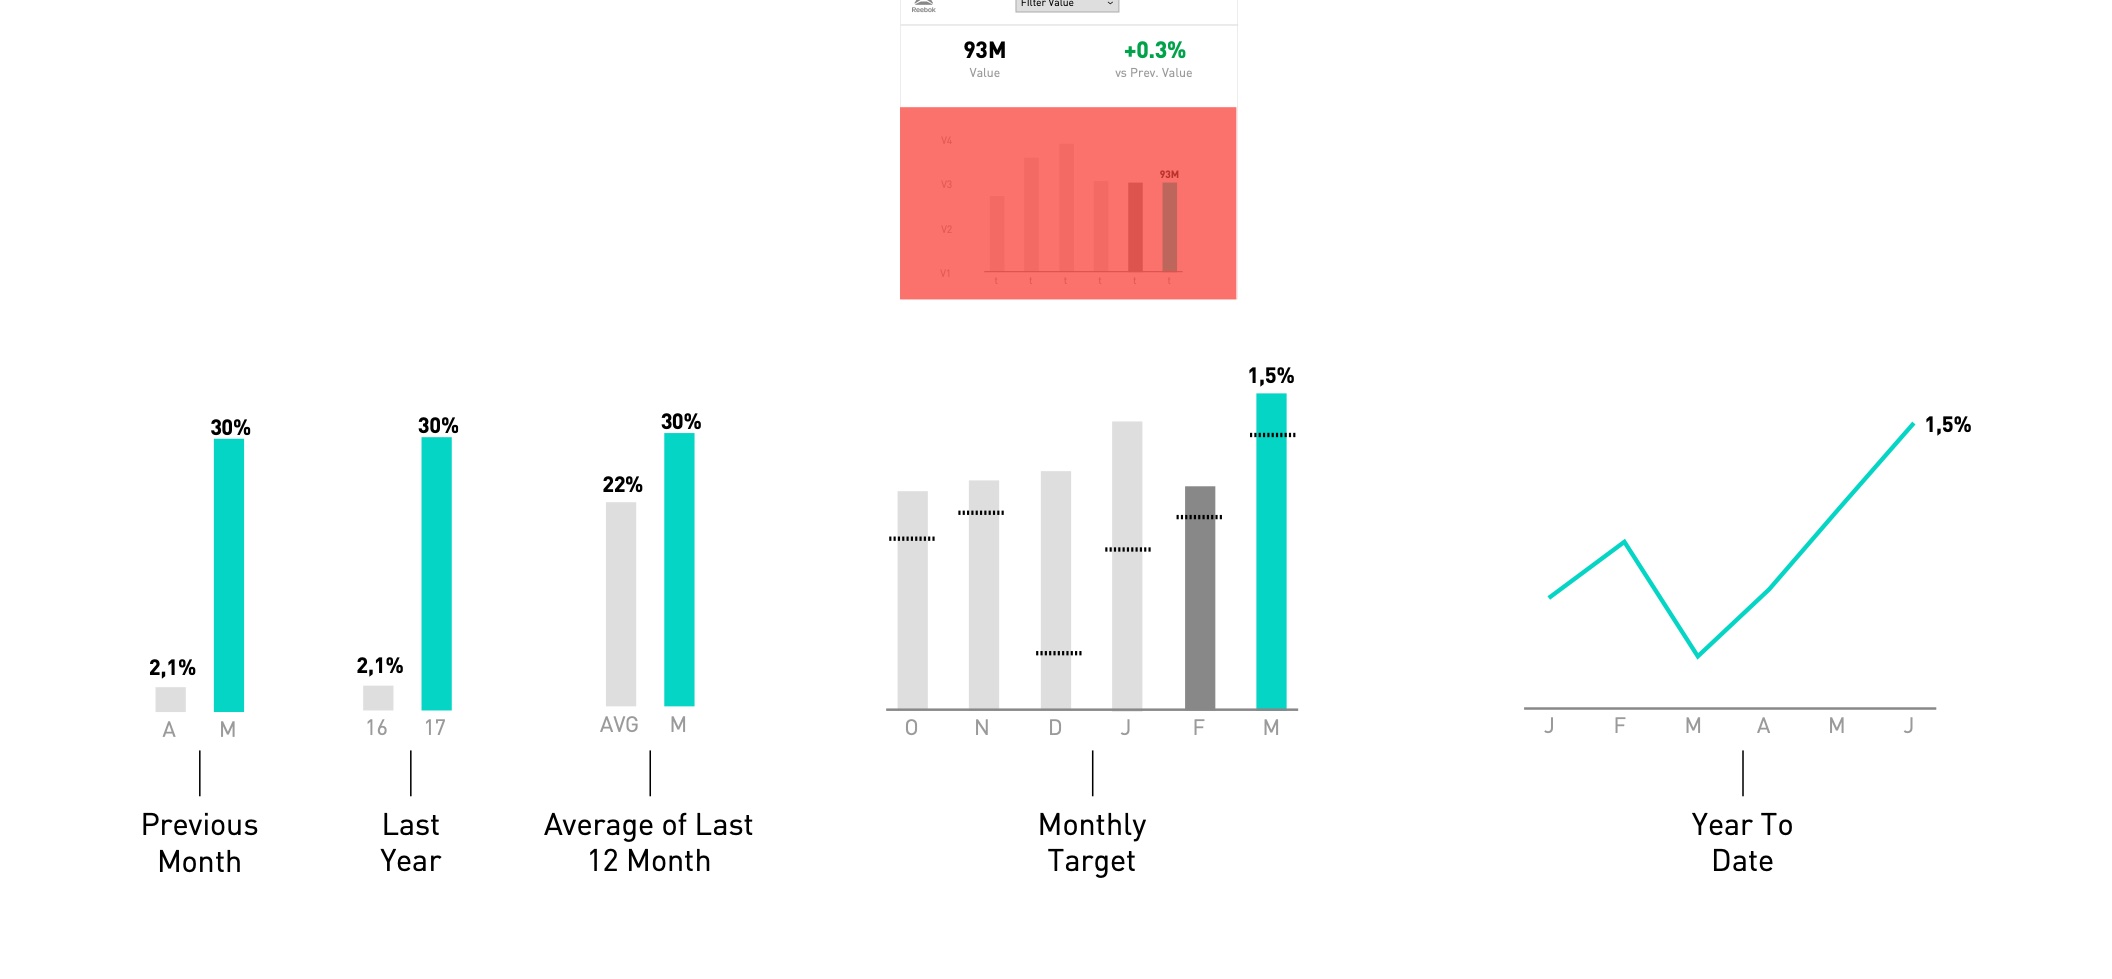
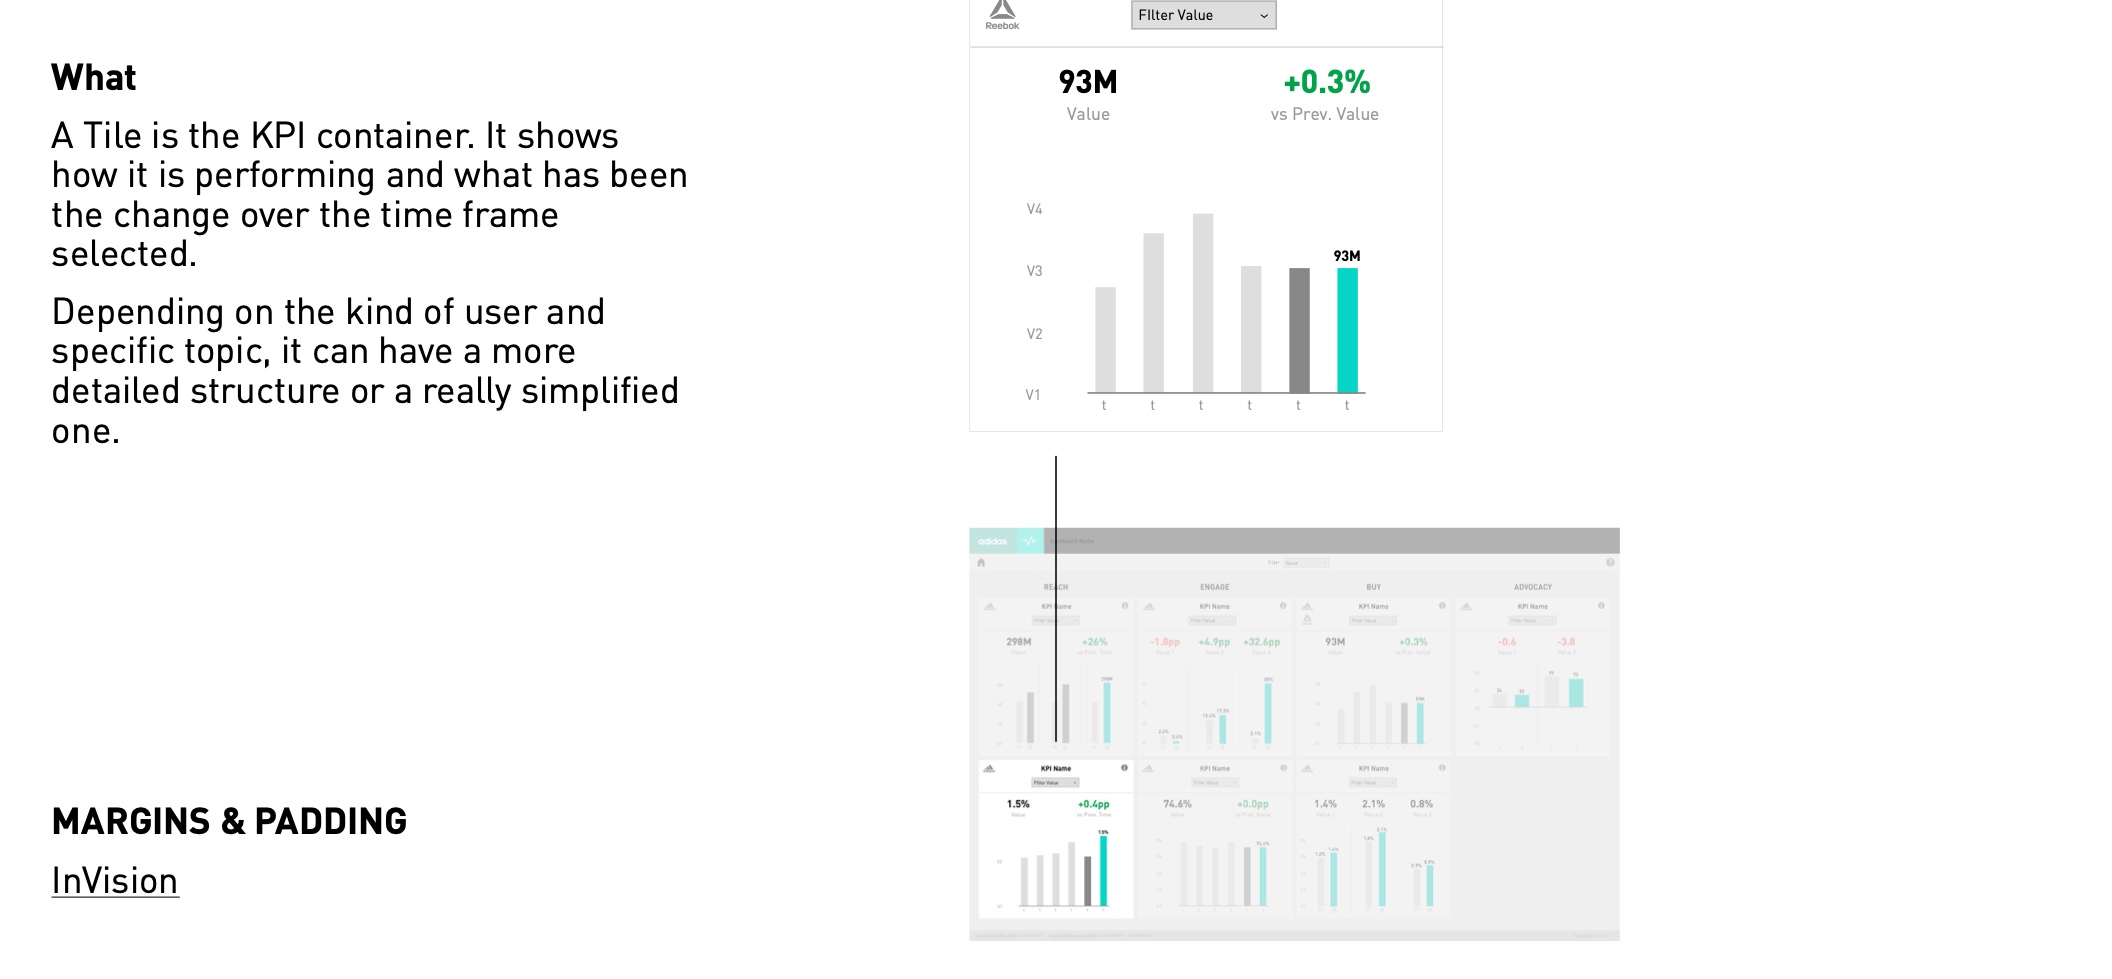
A tile is the KPI container: it shows how a KPI is performing and how it changed over the selected time frame. Depending on the user and topic, it can be detailed or really simplified.
Normal
Low density of KPIs — leadership users.
Small
Medium density — PM and PO users.
Minimized
High density — analysts.
Library
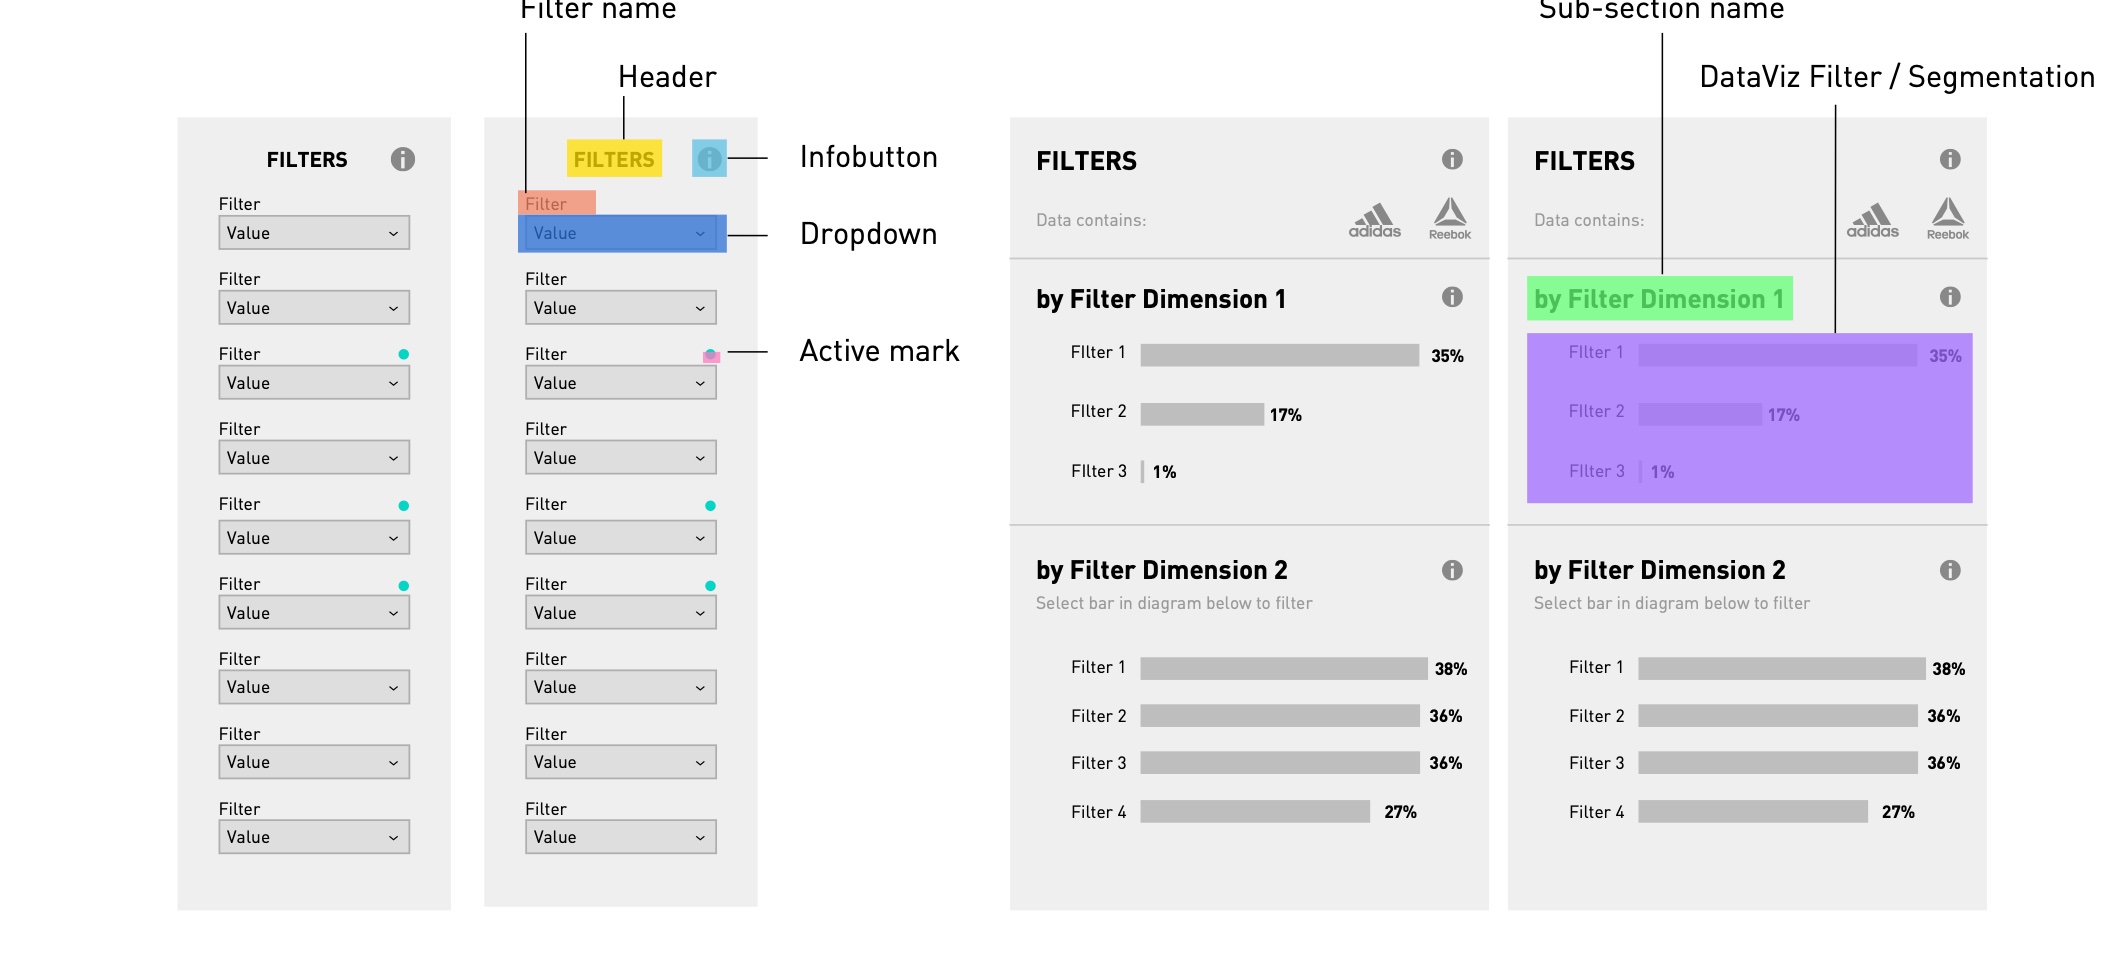
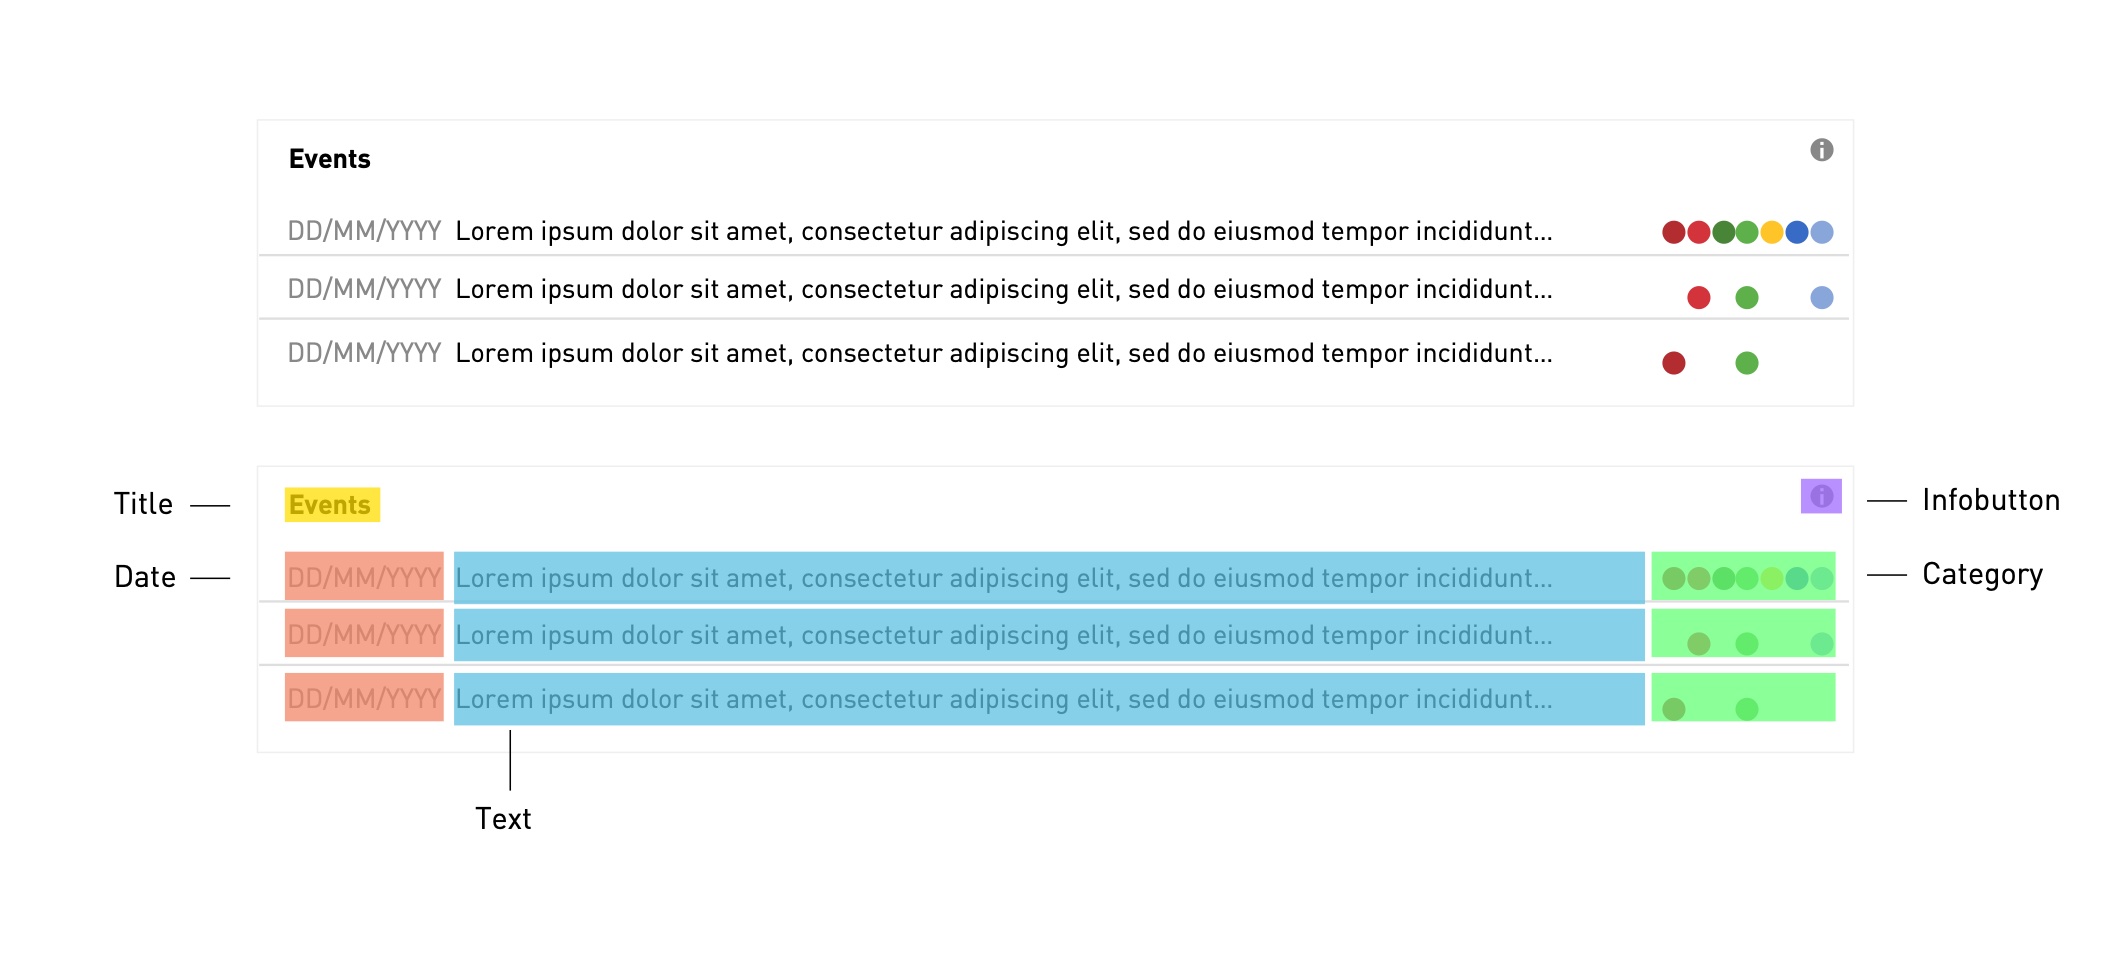
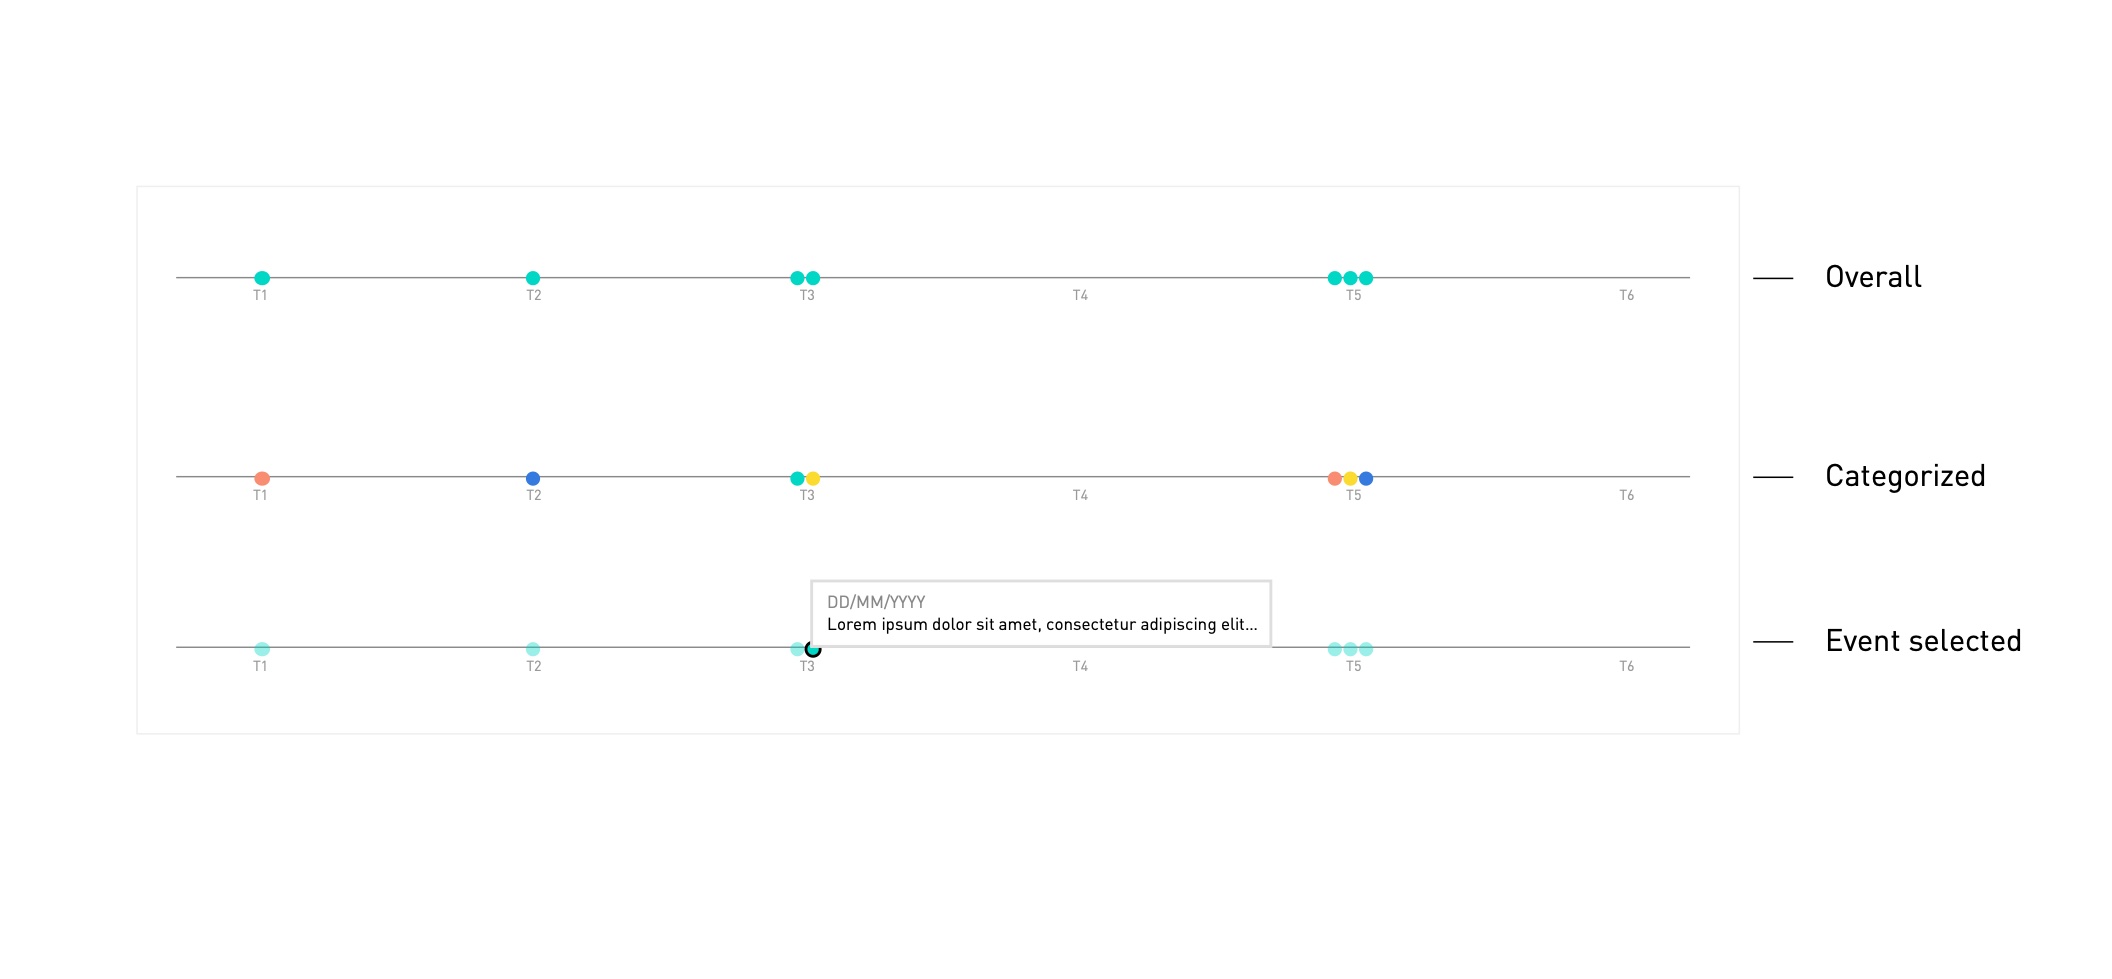
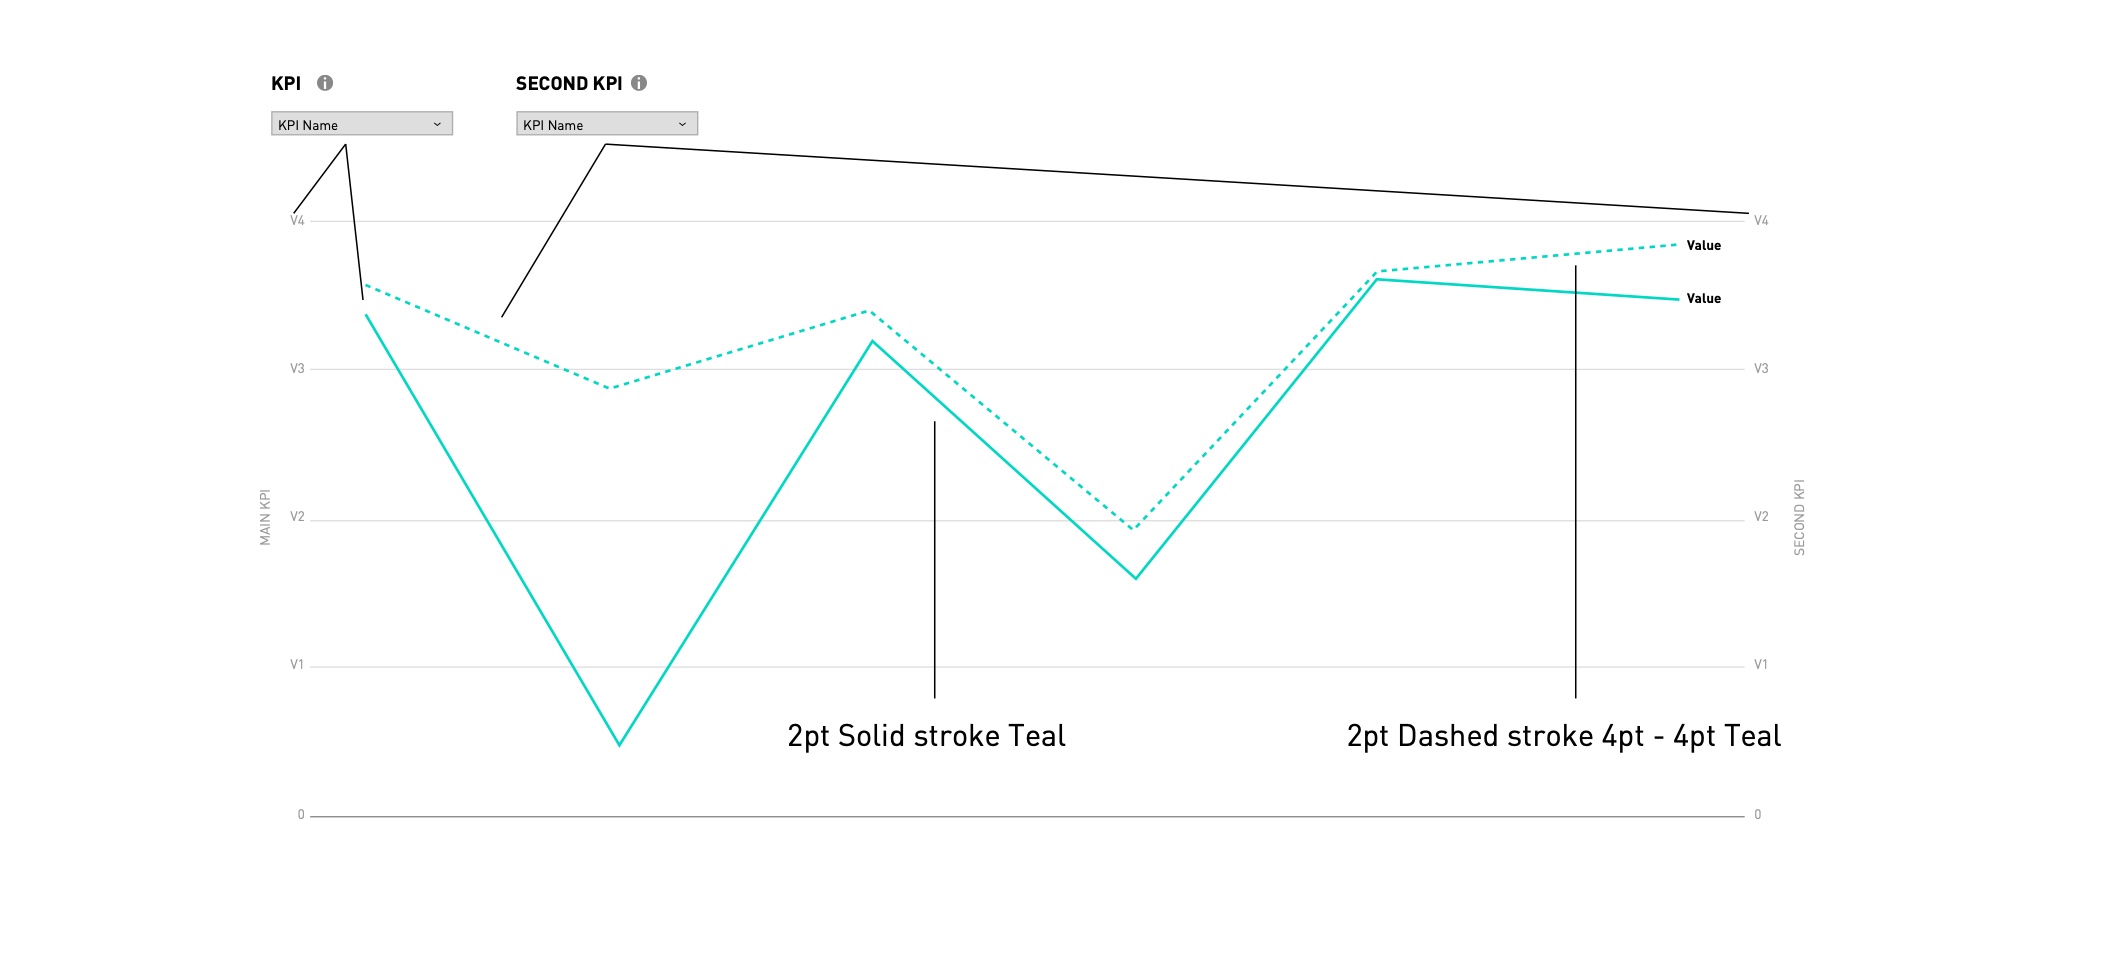
# Charts & colours
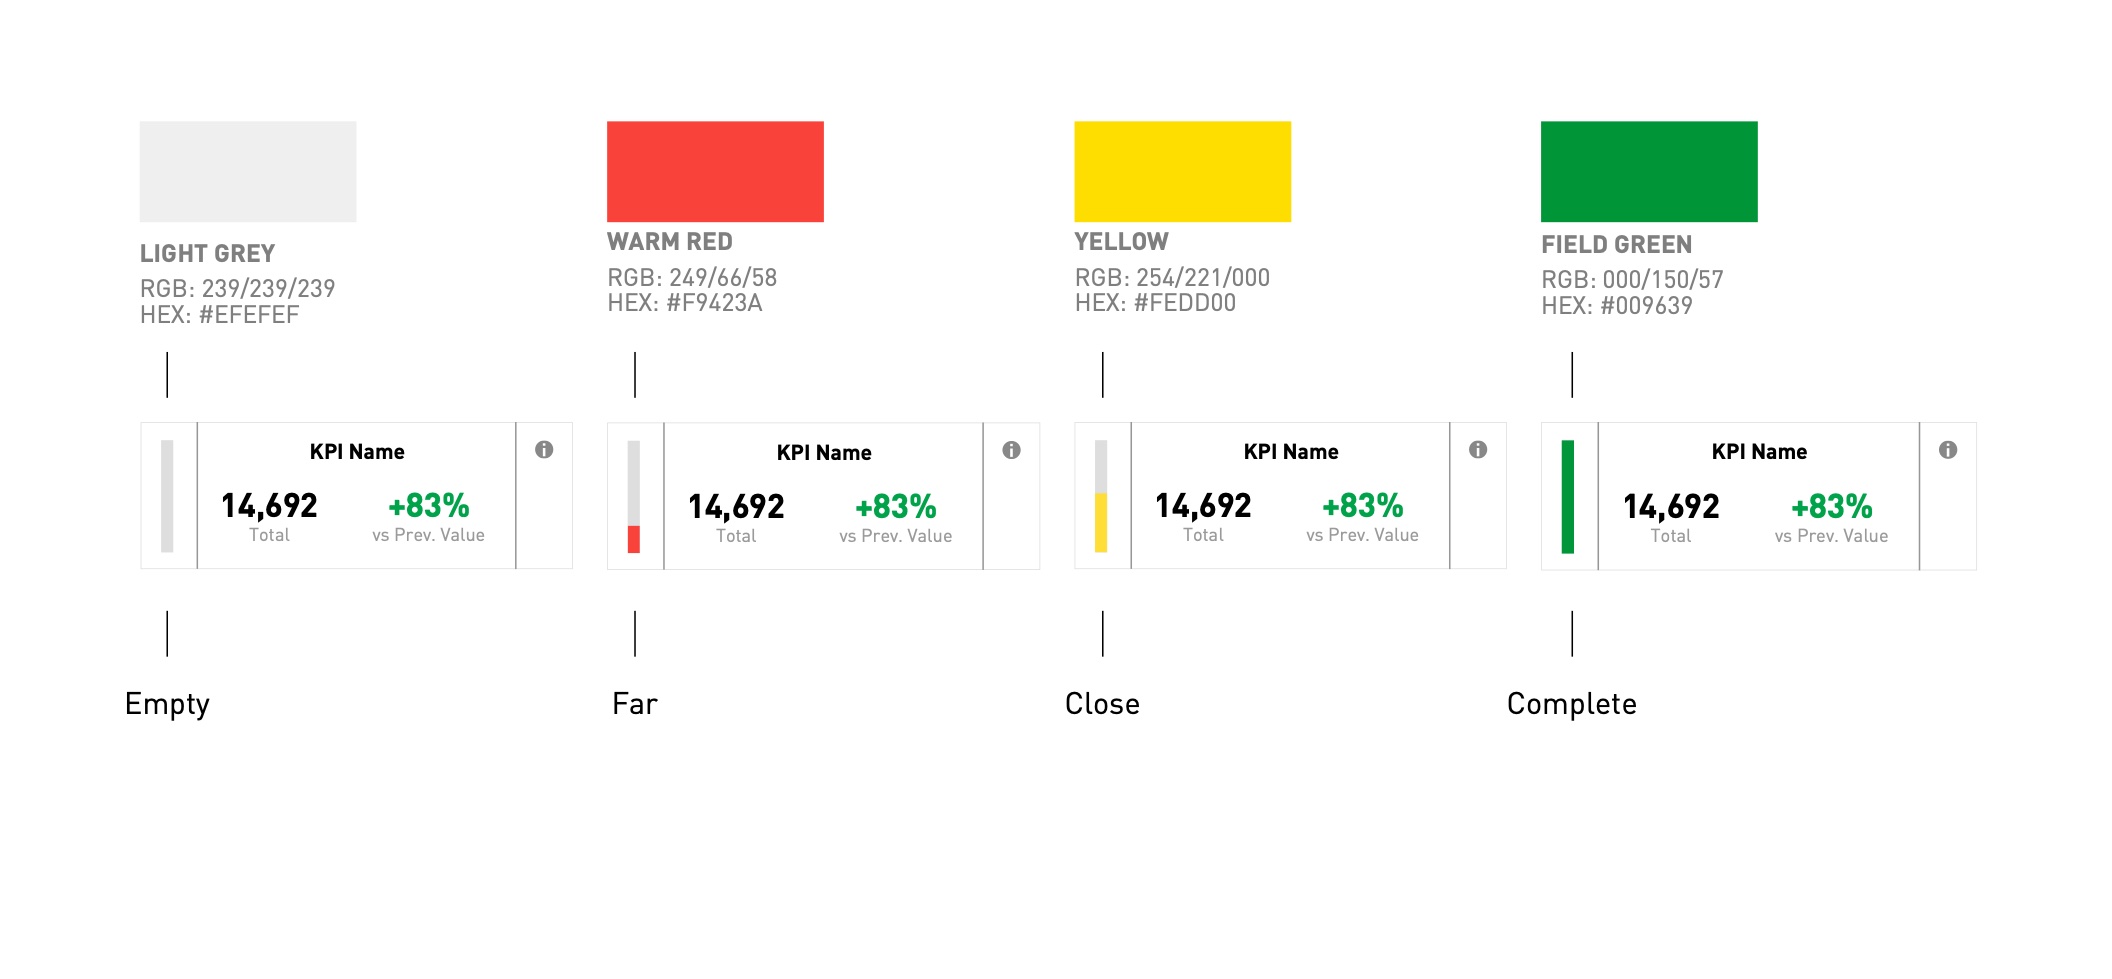
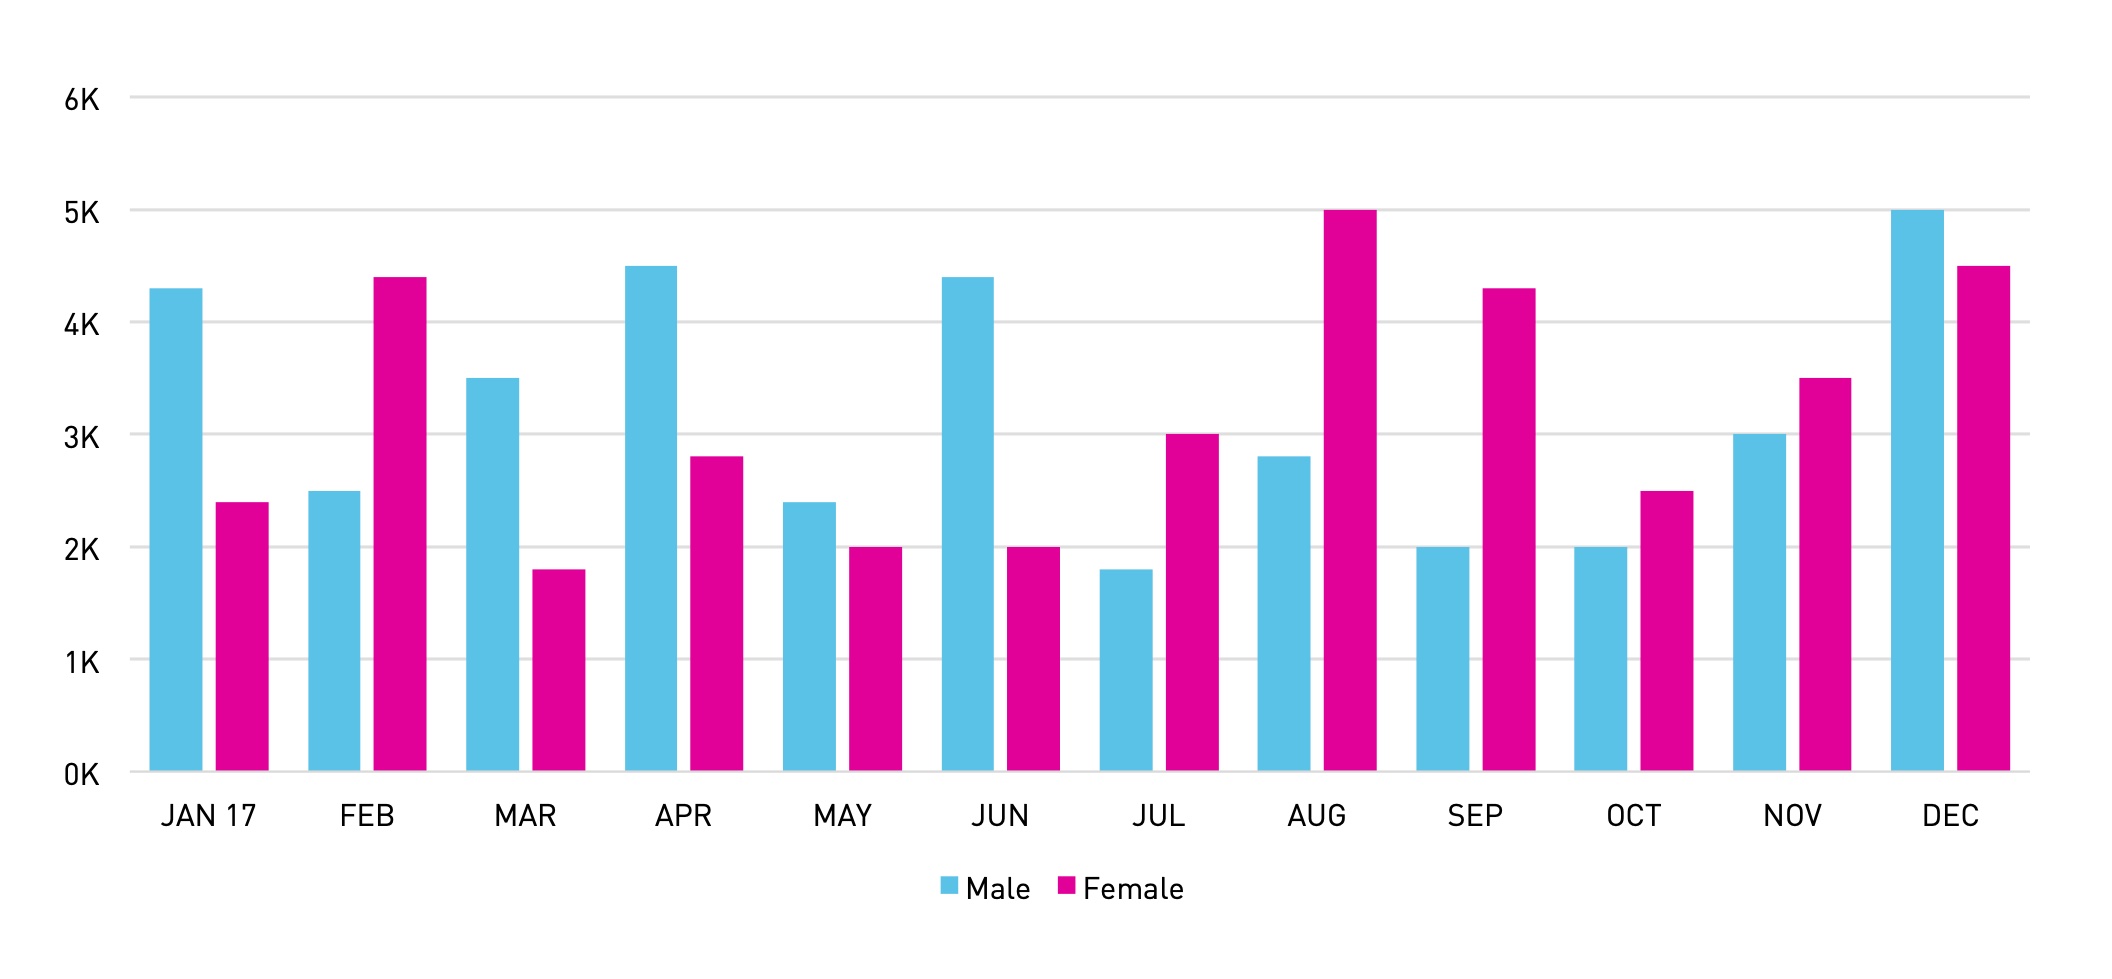
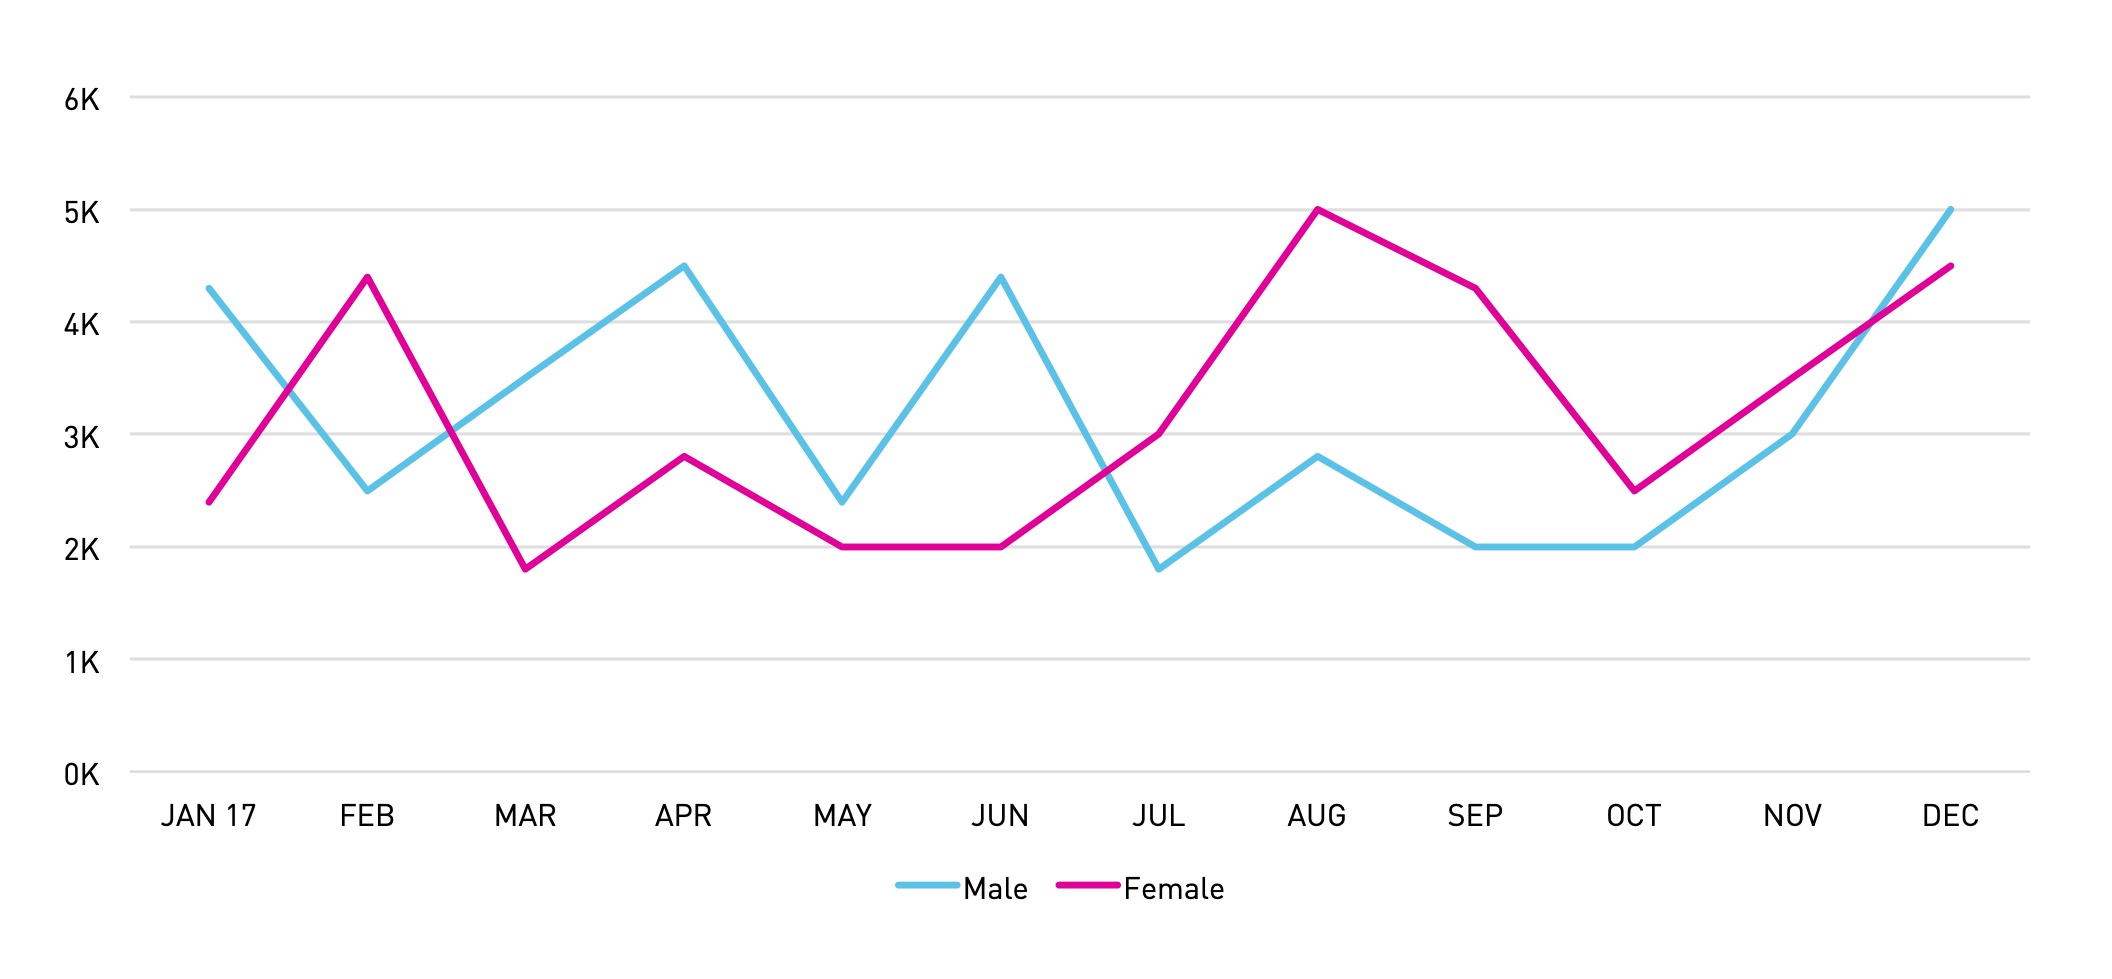
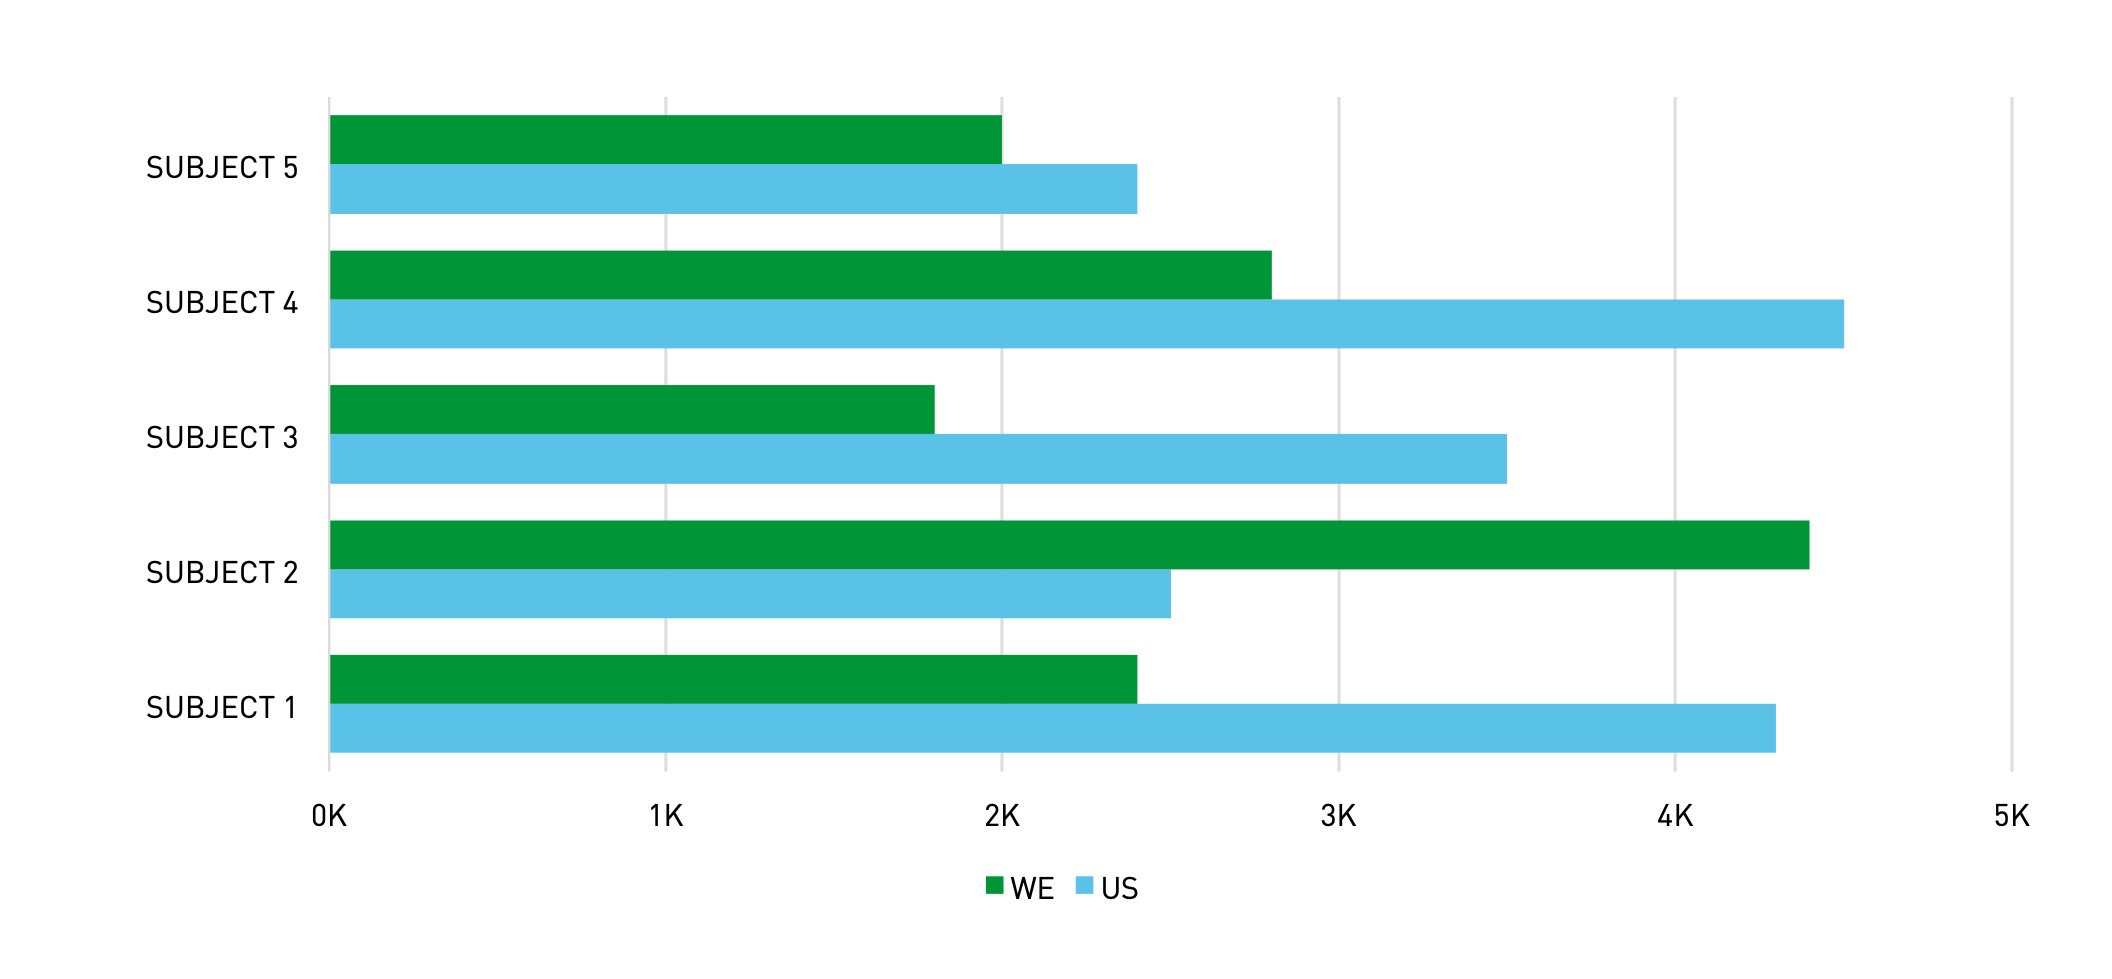
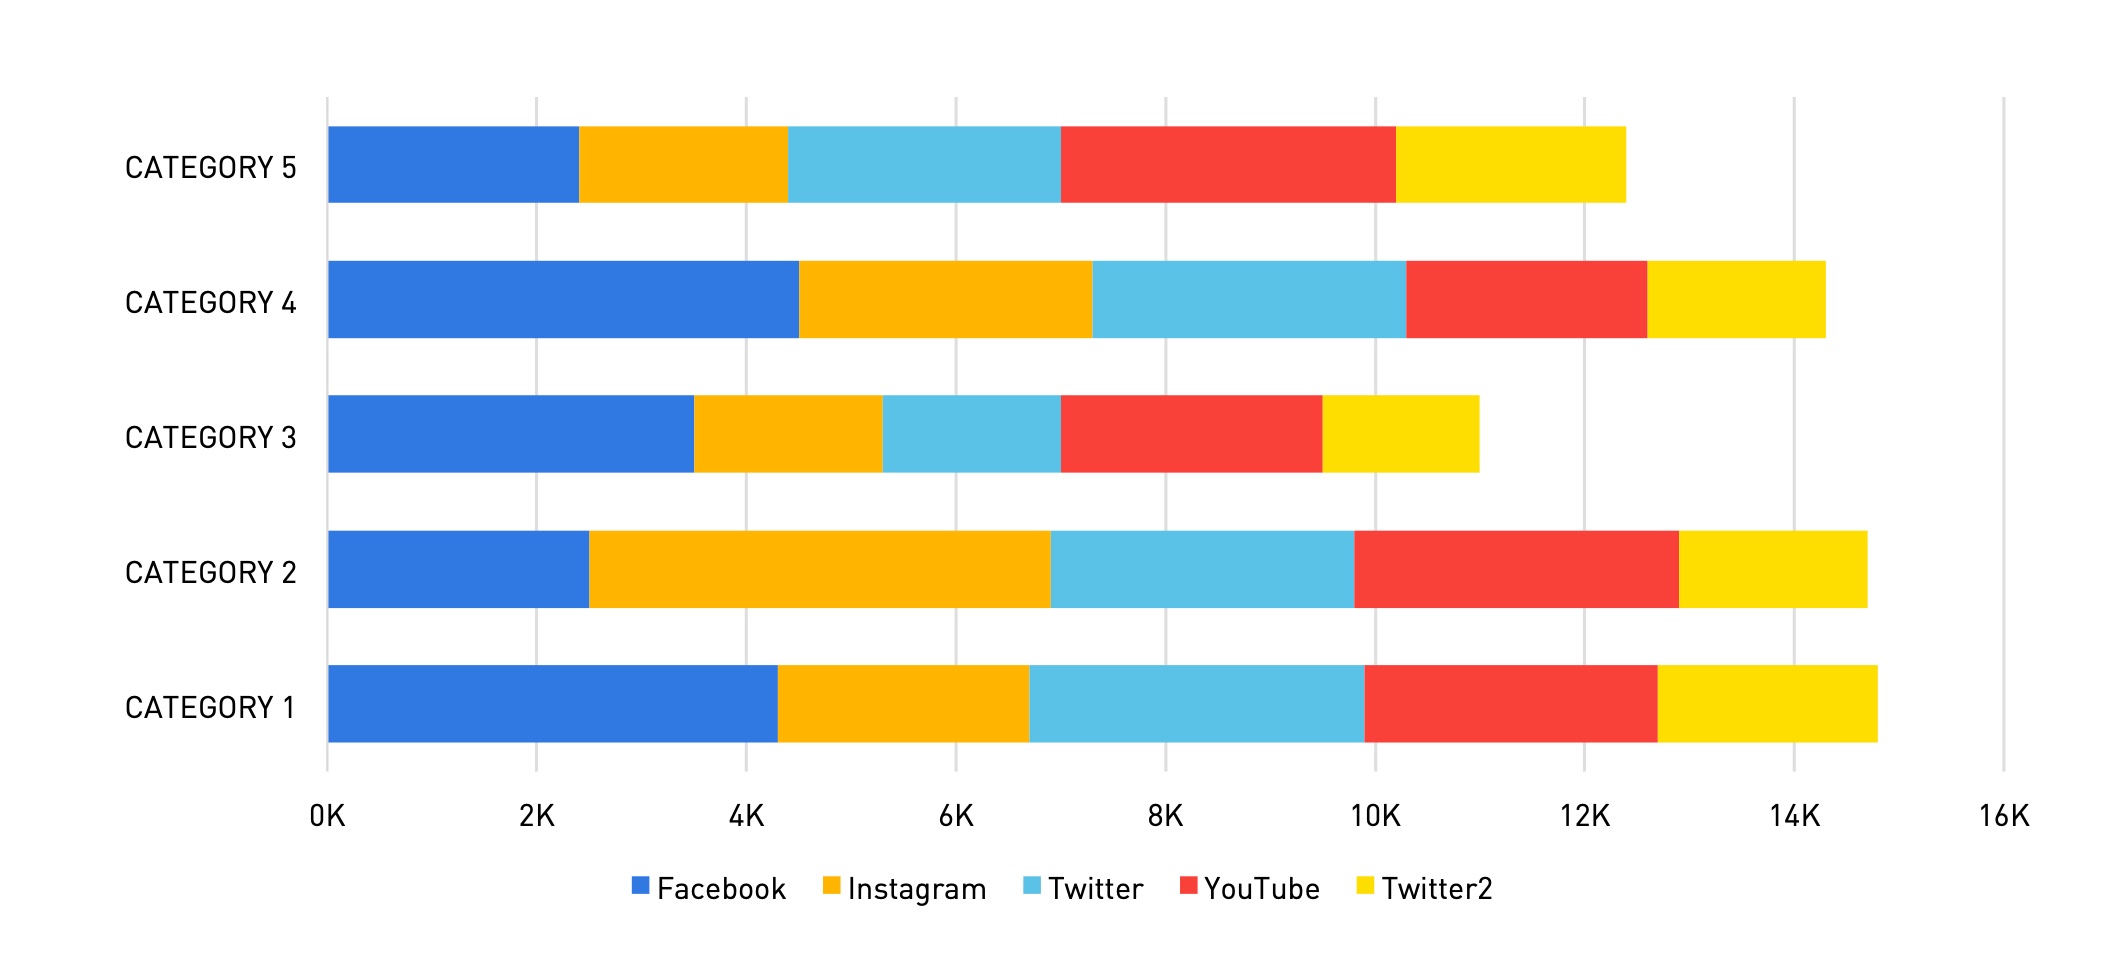
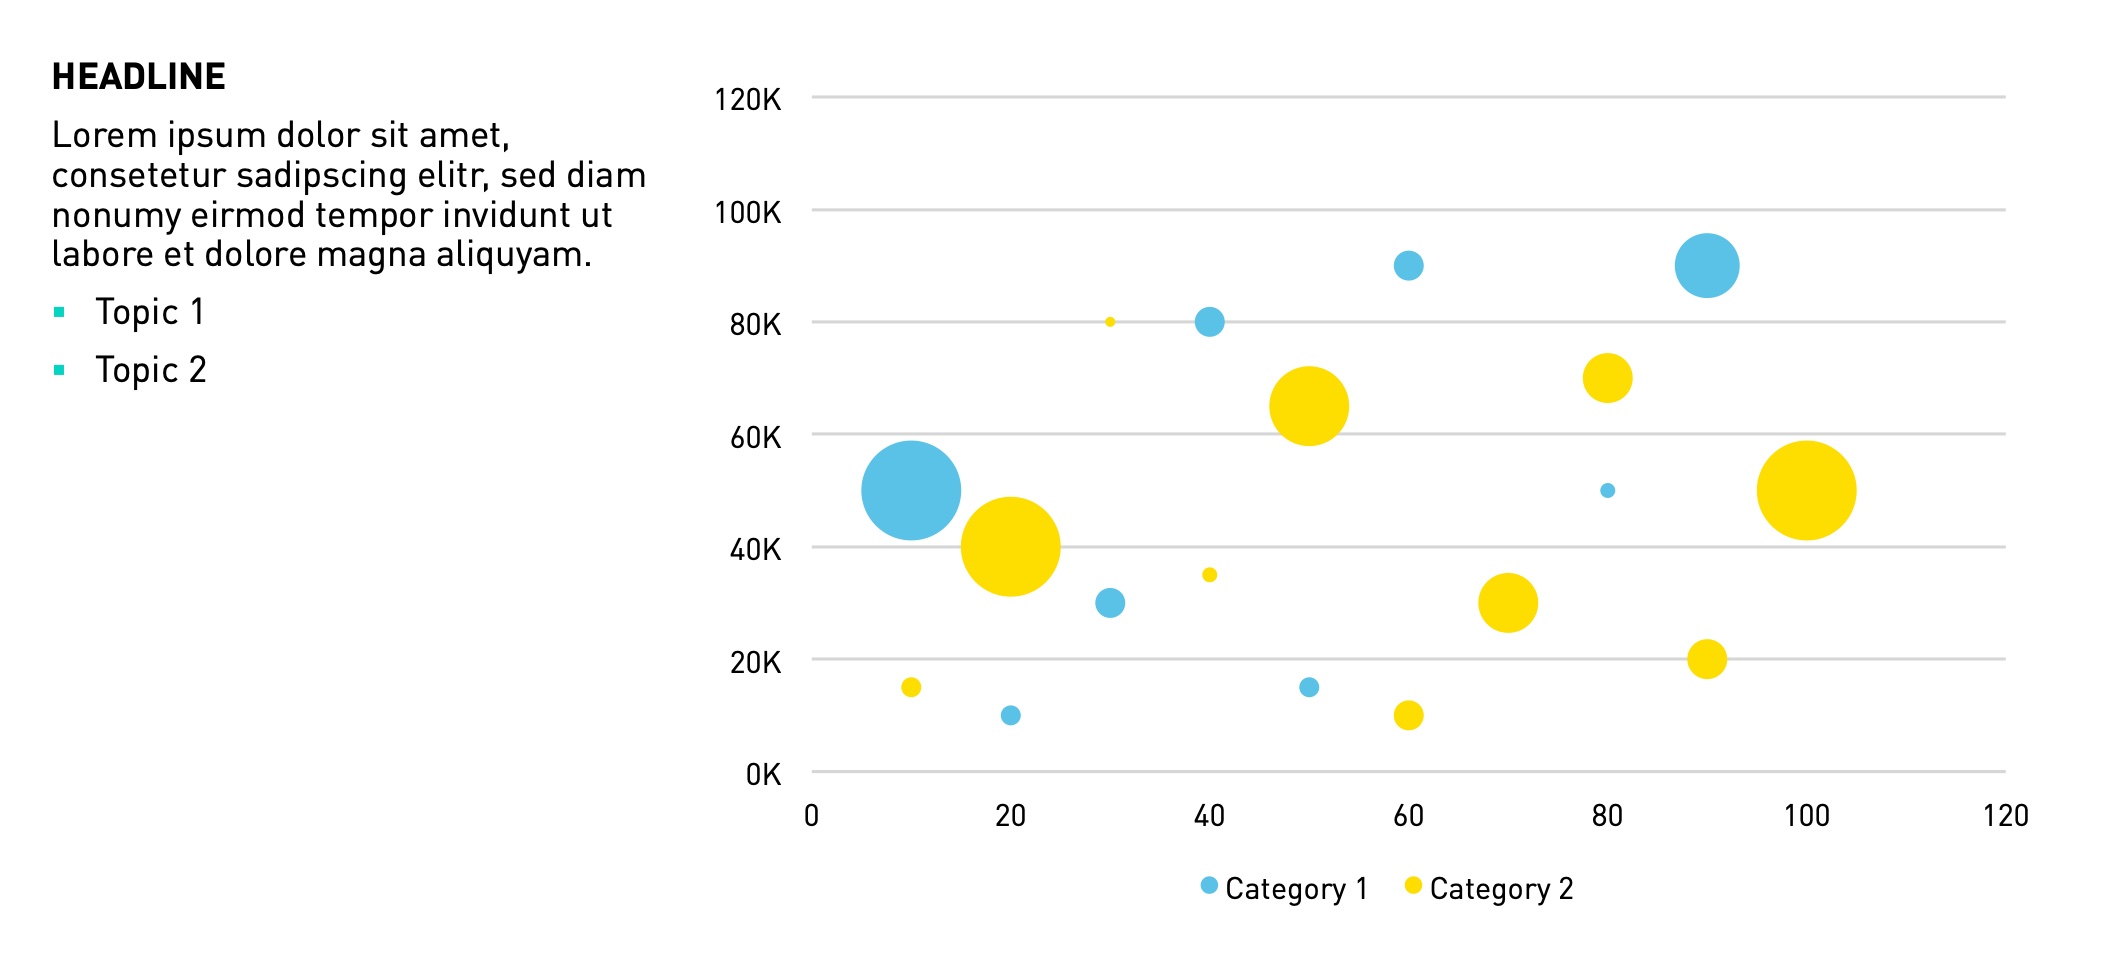
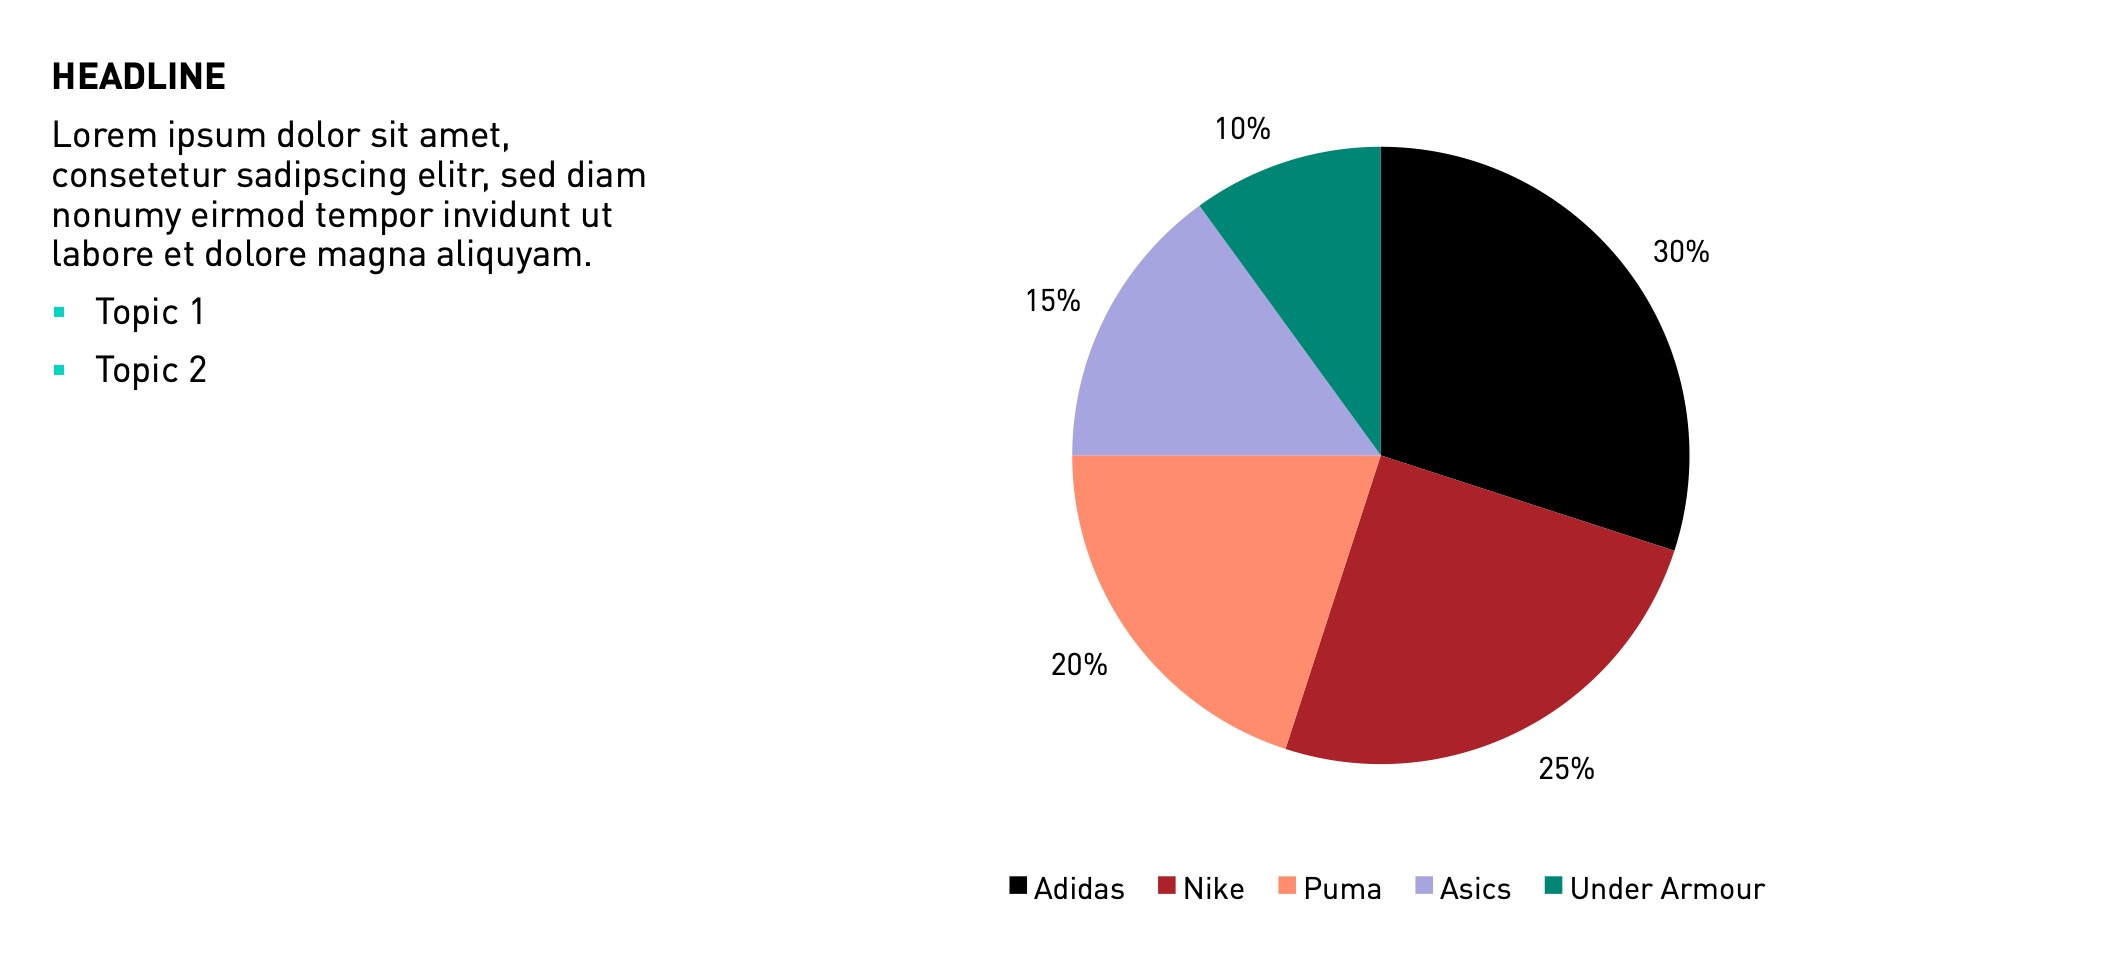
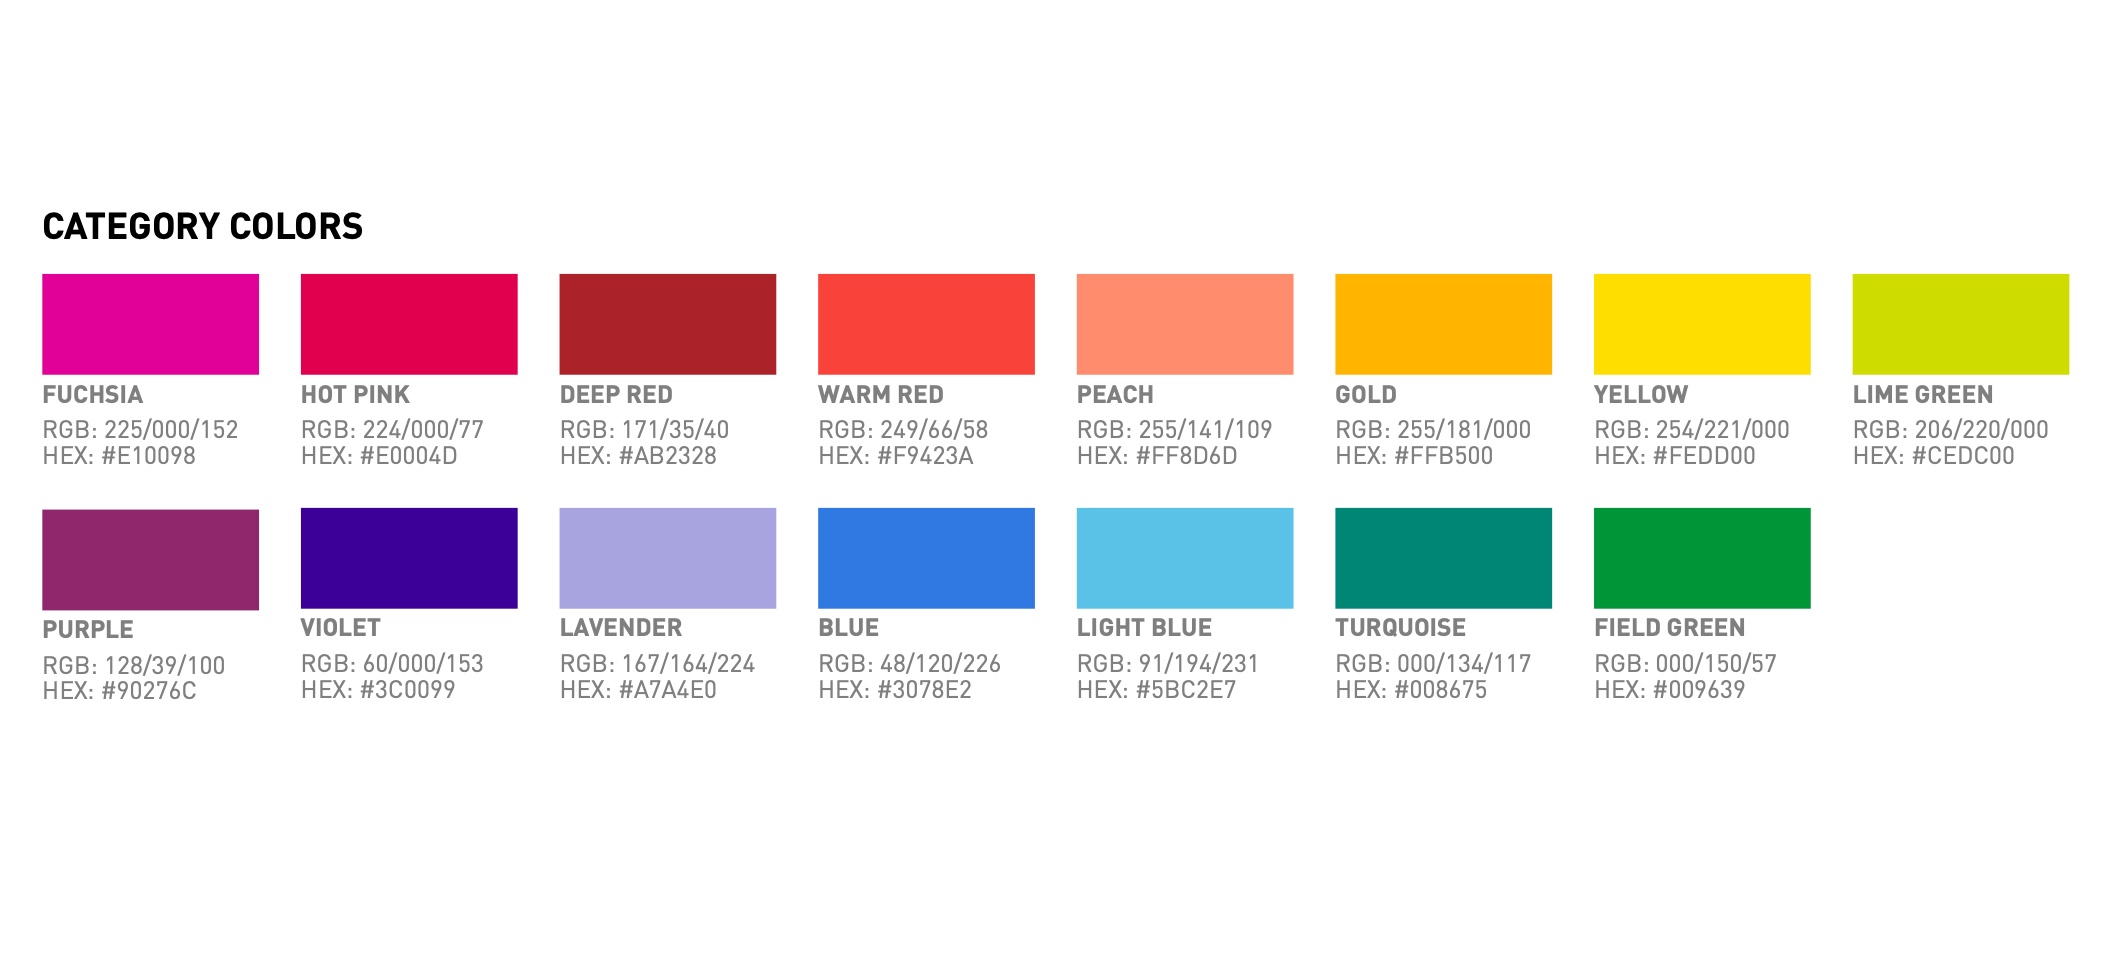
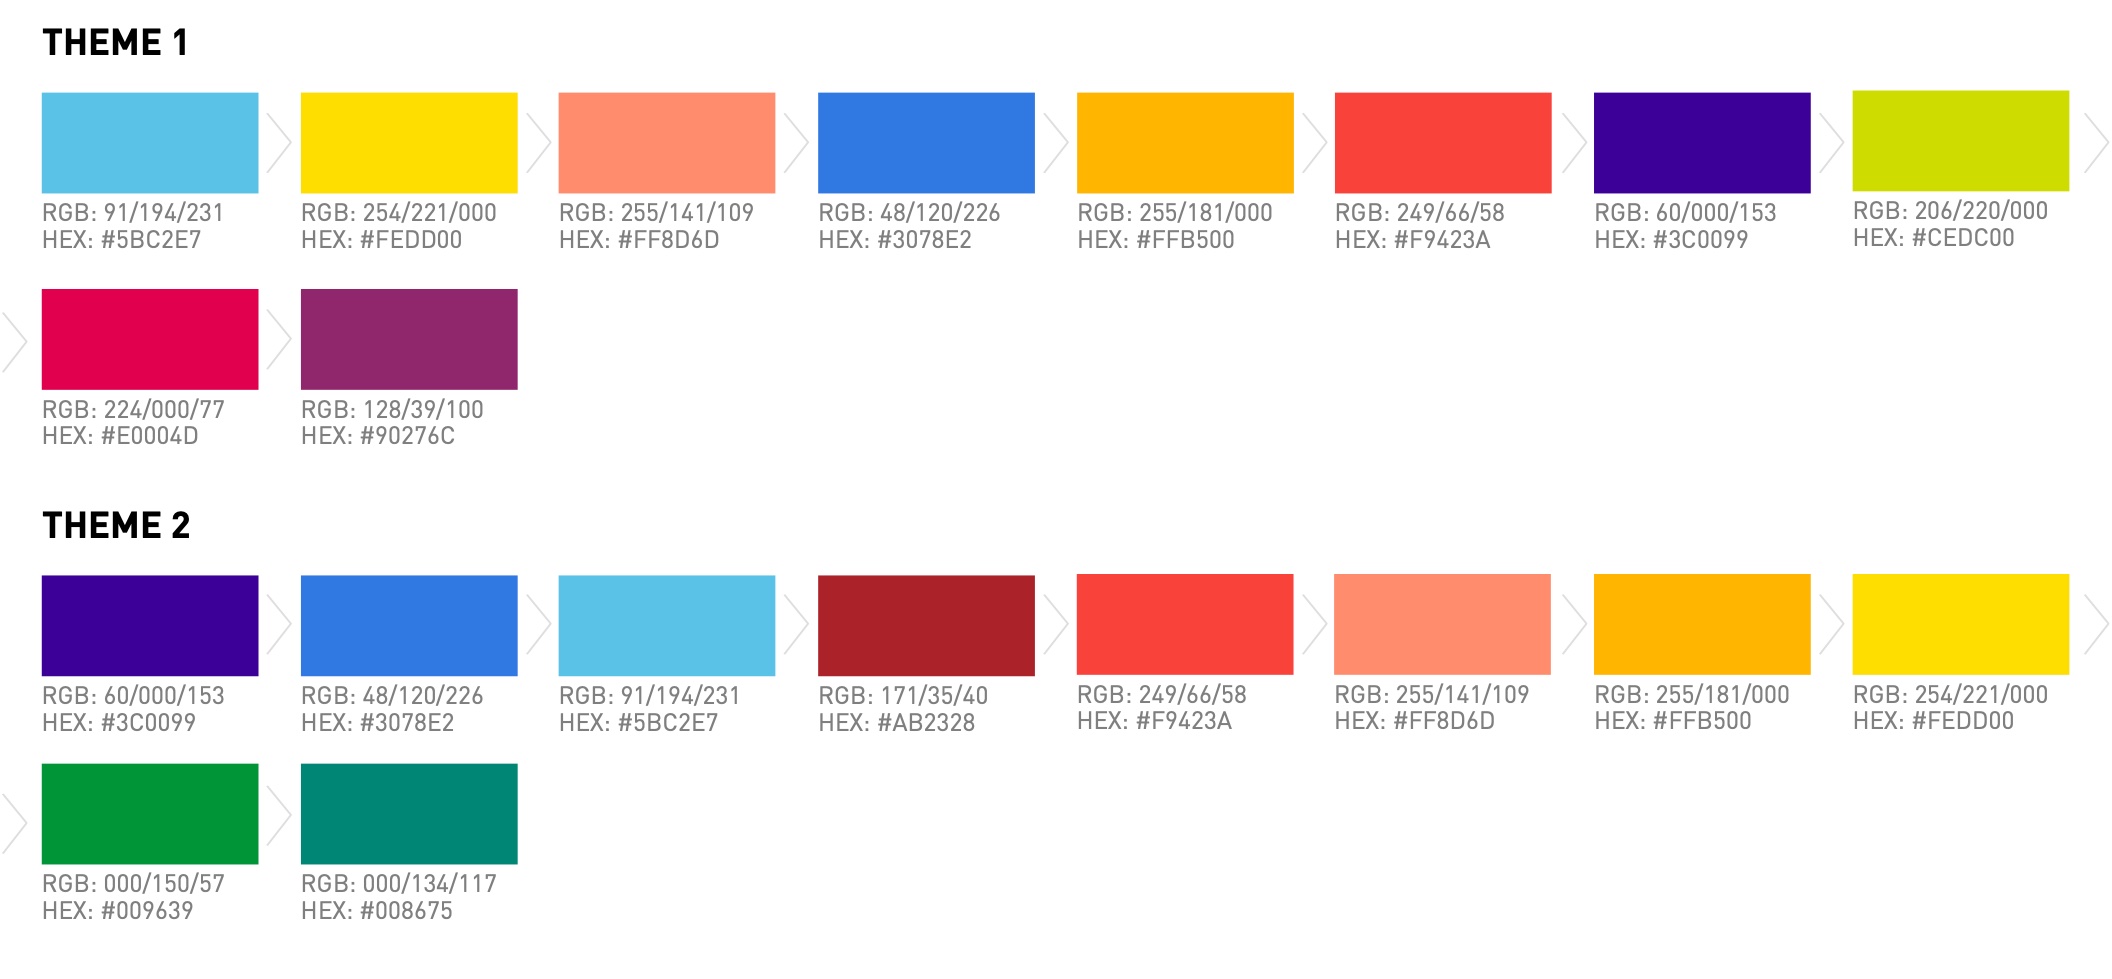
Chart templates ready to reuse, and colour palettes with fixed meanings — category colours, two themes, and dedicated colours for business units, markets, channels, genders, age groups, devices and more — so the same dimension always looks the same across dashboards.
# In use
Example dashboards built on the guidelines, with components shared in Zeplin and prototypes in InVision.